Bitcoin Bollinger Band Volatility Breakout
The BTCUSD Crypto Bollinger Bands Volatility Indicator are self adjusting which means the Bollinger bands widen and narrow depending on bitcoin price volatility.
Standard Deviation is the statistical measure of bitcoin price volatility that is used to calculate the widening of the bitcoin Bollinger bands or narrowing of the bitcoin Bollinger bands. Standard deviation will be higher when the bitcoin prices are changing significantly and Standard deviation will be lower when the cryptocurrency market prices are not changing a lot.
- When the bitcoin price volatility is high the Bollinger Bands widen - Bollinger Bands Breakout Strategy.
- When bitcoin the bitcoin price volatility is low the Bollinger Bands narrows - Bollinger Bands Consolidation Strategy.
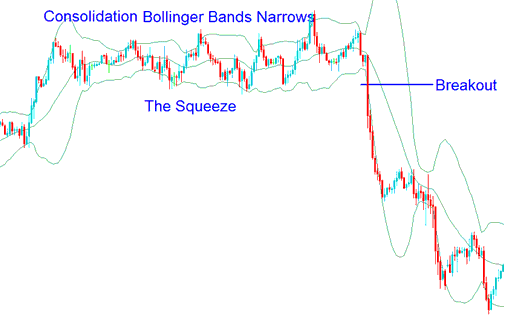
The Bollinger Band Squeeze
Narrowing of the bitcoin Bollinger Bands is a sign of bitcoin price consolidation and is known as the Bollinger Bands Squeeze.
When the Bollinger Bands indicator illustrate narrow standard deviation it's usually a time of bitcoin price consolidation, and this is also a bitcoin signal that there will be a bitcoin price breakout and it shows that bitcoin traders are adjusting their bitcoin trade positions for a new bitcoin trend move. Also, the longer the bitcoin prices stay within the narrow Bollinger Bands range the greater the chance of a bitcoin price break out.
Bollinger Bands Squeeze - Bollinger Bands Breakout Strategy - Bollinger Bands Consolidation Strategy Method
BTCUSD Bollinger Band Volatility Break out
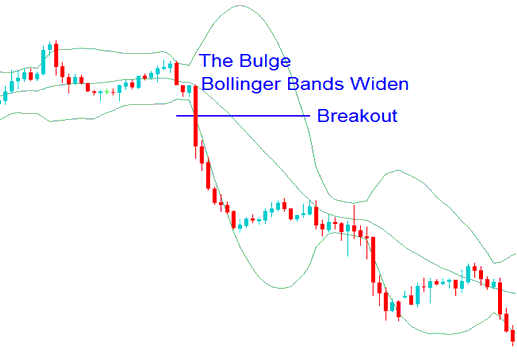
The widening of Bollinger Band indicator is a sign of a bitcoin price break out and this is known as Bollinger Bands Bulge.
Bollinger Band indicator that are far apart can be interpreted as a signal that a bitcoin trend reversal is likely to happen. In the Bollinger Bands indicator cryptocurrency example illustrated below, the bitcoin Bollinger Bands get very wide as a result of high bitcoin market price volatility. The bitcoin crypto currency trend reverses as bitcoin crypto currency prices reach an extreme level according to statistics and the theory of normal distribution. The "Bollinger Bands Bulge" predicts the change of the trend to a bitcoin trading down-ward trend.
Bollinger Bands Bulge - Bollinger Bands Volatility Breakout - Bollinger Bands Breakout Strategy Method
Bollinger Bands Volatility Bitcoin Trading Break out - Bitcoin Trading Analysis Using Bollinger Bands Volatility Cryptocurrency Indicator - Bollinger Bands Breakout Bitcoin Strategy - Bollinger Bands Consolidation Strategy Method
More Courses and Tutorials:
- How Do I Analyze BTC USD Channels in BTC USD Analysis?
- BTC USD Trade MetaTrader 5 Fibonacci Extension Trading Indicator on MetaTrader 5 Platform
- How Do I Analyze Ascending Triangle Chart Pattern Described?
- Trade Bullish Trading Divergence BTC USD Trade Platform Software
- Learn Technical Indicators in BTC USD Trade
- What Happens in BTC USD Trade after a Trendline is Broken?
- How Do I Analyze BTC USD Strategies Guide?
- BTC USD Trade Add a Custom MT4 BTCUSD Trading Indicator on MetaTrader 4 Platform
- BTC USD Price Pullback Explained with BTCUSD Example
- BTC USD Chart Patterns BTC USD Strategies


