Bollinger Percent B Bitcoin Analysis & Bollinger Percent B Trading Signals
Developed by John Bollinger
Percent B indicator is derived from Bollinger Band.
This is an oscillator trading which has 3 lines - 0, 50, 100
- 0 represents lower Band
- 50 represents middle Band
- 100 represents upper Band
Percent B oscillates between these three points and it shows where the bitcoin price is in relation to the 3 Bollinger Bands.
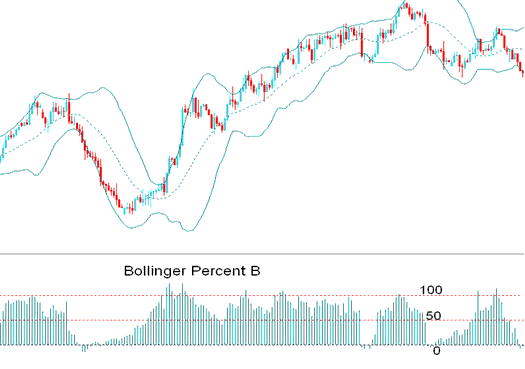
%b indicator
When the bitcoin price touches the upper band then the oscillator hits 100, if bitcoin price moves above the upper band the oscillator moves to +100
When the bitcoin price touches the lower band then the oscillator hits 0, if bitcoin price moves below the lower band the oscillator moves to -0
When the bitcoin price touches the middle band then the oscillator will be at 50.
Calculation
Percentage B = Bitcoin Price Close - Lower Band * 100
Upper Band - Lower Band
Bitcoin Crypto Analysis and Generating Signals
Percent B indicates to what degree the bitcoin price closes above or below any of the bands.
Buy Trading Signal
Oscillator Technical values above 50 is a bullish signal.
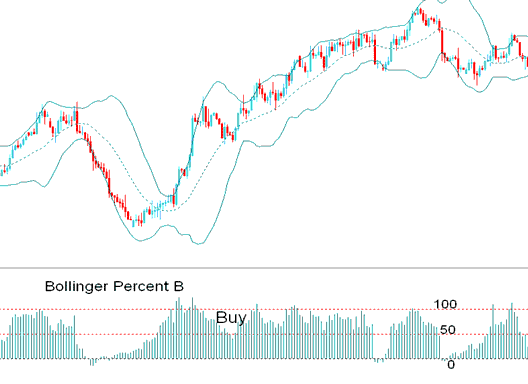
% b Bullish Buy Trading Signal
Sell Trading Signal
Oscillator Technical values below 50 is a bearish signal.
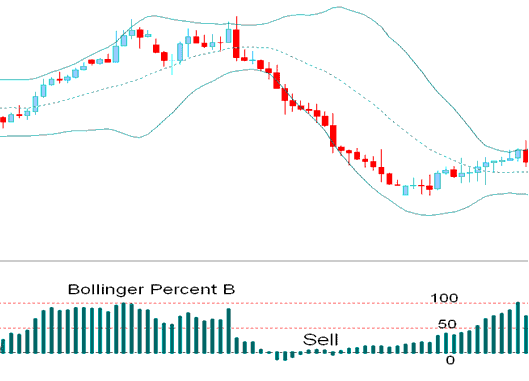
%b Bearish Sell Trading Signal
Learn More Topics & Tutorials:
- BTC USD Trade Identify a BTCUSD Candlestick
- How to Analyze Chart using Indicators
- How Do I Download BTCUSD Trade MetaTrader 4 Trading Platform?
- BTC USD Trade Apps Tutorial Course
- How Do I Set Pending Order on BTC USD Trade Software Platform?
- Learn Bitcoin Trade for Beginners Learn Bitcoin Training Course Tutorial
- BTC USD Trading Indicators & Bitcoin Trade Strategies
- BTC USD Trade Real Account Open DD
- How to Analyze a BTCUSD Trade Candlestick Pattern
- Chandes Q-Stick BTCUSD Indicator Technical Analysis in BTC USD Trade


