Bollinger Band
Derived from the original Bollinger bands.
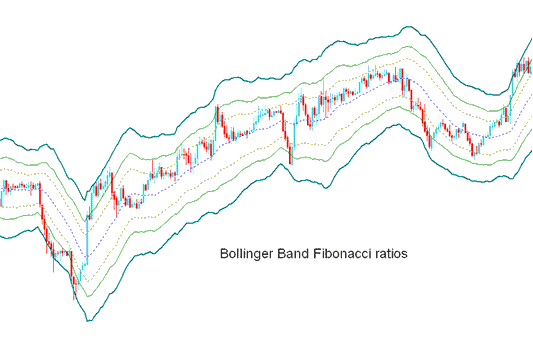
The Bollinger Fibonacci ratios is a volatility based indicators but it does not use the standard deviations to calculate the width of the bands instead it uses a smoothed ATR that are multiplied with Fibo ratios of 1.618, 2.618, & 4.236.
The smoothed lines that are multiplied with Fibo ratios are then added or subtracted from the MA.
This forms 3 upper Fibonacci bands and Three lower Fibonacci bands
Middle band forms the basis of the trend.
BTCUSD Analysis and How to Generate Signals
This btcusd indicator used to determine point of support and resistance for bitcoin crypto.
The lines below represent support points while those above are resistance levels.
The outermost bands provide the strongest resistance/support.
Inner most bands provide least support/resistance.
The innermost band represents Fibonacci 38.20% retracement level
The second band represents Fibonacci 50 percent% retracement level
The outermost band represents Fibonacci 61.80% retracement level
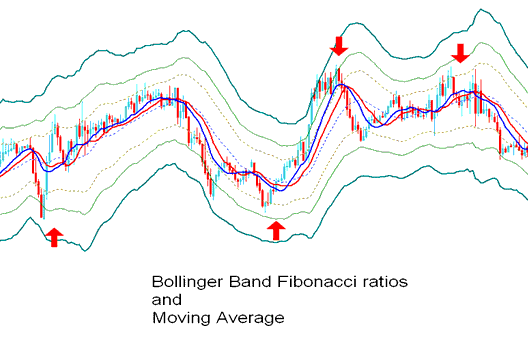
The indicator is used to determine points where bitcoin price might reverse. (Bitcoin Price Pullback Levels)
When bitcoin price hits one of the lines and reverses then an entry or exit signal gets generated.
However, it is always good to combine the signal with other confirmation indicators such as the moving average to confirm the signal as shown below.
Technical Analysis in Bitcoin Crypto Trading
Learn More Topics & Courses:
- How to Trade BTC USD Trading Analysis Trading Strategies
- Darvas Box Bitcoin Technical Indicator Analysis in Trading Charts
- MT5 Download BTC USD Price Data to Test BTC USD Trading Automated EA Expert Advisors
- What is the Difference between Buy Limit BTC USD Order & Buy Stop Bitcoin Order?
- How Can You Analyze a Trend Reversal Signal in Trading Chart Signals?
- How Can You Trade on MT4 Trading Software?
- How to Trade with Trade Software Platform Course Tutorial
- How Can You Trade BTCUSD on MT5 iPhone Trading App?
- How to Draw Trendline on Trading Chart on Software
- MT4 Bitcoin Trading Software Ichimoku Kinko Hyo BTCUSD Technical Indicator Download


