How to Draw Bitcoin Trend Lines & Channels on Charts
Sometimes support and resistances are formed diagonally in a similar way like a stair case. This forms a bitcoin trend which is a sustained movement in one direction either upwards or downwards.
A bitcoin trend line depicts the points of support & resistance for the bitcoin trading price, depending on the direction of the market. For an upward moving cryptocurrency trading market trend - bitcoin trend line will shows the points of support and for a downward moving cryptocurrency trading market trend - bitcoin trend line will show the areas of resistance - bitcoin trendlines are mainly used by many traders to determine these resistance and support levels on bitcoin charts.
A Bitcoin Trend line is a slanting straight line that connects two or more bitcoin price points and extends into the future to act as a zone of support or resistance for the trading price movement. There are two different types of bitcoin trend lines: upward btcusd crypto trend line and downward bitcoin trend line. Bitcoin trendline is an aspect of trading analysis that uses line studies to try & predict where the next bitcoin trading price move will head to. A trader must know how to draw & interpret signals generated by this bitcoin trend line tool.
The basis of this trading analysis is based upon the idea that markets move in trends. Bitcoin trend-lines are used to show three things.
- The general direction of the market - up/down.
- The strength of the current bitcoin trend - and
- Where future support and resistance will be likely located
If bitcoin trend lines forms in a certain direction then the btcusd trading market usually moves in that direction for a period of time until a time when this bitcoin trend line is broken.
Drawing these bitcoin trend lines on a chart displays the general bitcoin trend of the btcusd trading market which can either be upward or downwards.
Shown Below is an example of how to draw these bitcoin trend lines on bitcoin charts
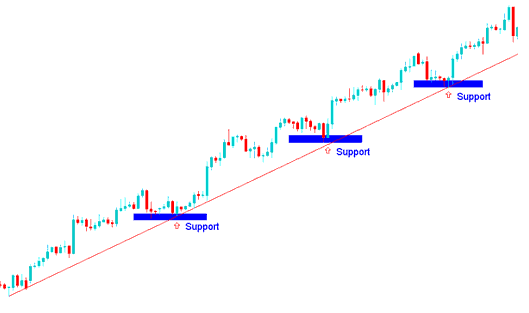
Tutorial: How to Draw Up-wards Bitcoin Trend Line & Trade Upwards Bitcoin Trend Move
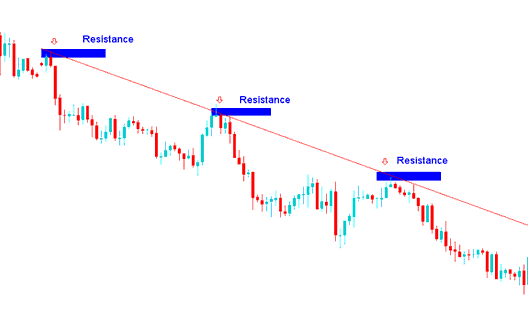
Tutorial: How to Draw Downwards Bitcoin Trendline and Trade Downward Bitcoin Trend Move
The MetaTrader 4 platform provides charting tools for drawing these bitcoin trend lines on charts. To draw bitcoin trendlines onto a chart, traders can use the bitcoin trading tools provided on the MT4 software that is shown below.
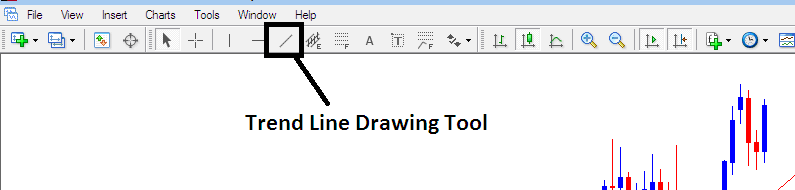
To draw bitcoin trendlines on a chart just click the MT4 Draw Bitcoin Trend Line Tools as shown above on the MT4 platform analysis software and select point A where you want to begin drawing the btcusd crypto trend line and then point B where you want the btcusd crypto trend line to touch. You also can right-click on the bitcoin trendline & on the properties option choose the option to extend its ray by ticking "ray check box", if you do not want to extend the bitcoin crypto currency trend-line, then uncheck this option in your MetaTrader 4. You also can change other bitcoin trend line properties such as colour & width on this property popup panel window of the bitcoin trendline properties. You can download MT4 software and learn bitcoin trend line technical analysis with it.
The btcusd crypto trend is your best friend. Is a popular saying among investors because you as a bitcoin trader should never go against it. This is the most reliable strategy to trade Bitcoin because once bitcoin trading prices start to move in one direction they can continue to move in that particular direction for quite some time - therefore using this bitcoin trend technique presents opportunity to make profits from the btcusd market.
Principles of How to Draw Bitcoin Trend-Lines
Use bitcoin crypto currency trading candle-stick charts
- The levels used to plot the bitcoin trend line are along the lows of the bitcoin trading price bars in a rising bitcoin market. An upward bullish bitcoin crypto trend move is defined by higher highs & higher lows.
- The points used to draw the bitcoin trend line are along the highs of the bitcoin crypto currency price bars in a falling downwards market. A downwards bearish bitcoin trend move is defined by lower highs & lower lows.
- The points used to draw bitcoin trend lines are extreme points - the high or the low bitcoin trading price. These extreme are crucial because a close that extends the extreme alerts investors the bitcoin trend might be changing. This is an entry or an exit signal.
- The more times a bitcoin trendline is hit but it is not broken, the more powerful its signal.
There are two main ways of trading this bitcoin trend line technical analysis setup:
- The Bitcoin Trendline Bounce - Bitcoin Trend Line Bounce
- The Bitcoin Trendline Break - Bitcoin Trend Line Break
Technical Analysis Methods of BTCUSD Trend-Lines
The bitcoin crypto currency trend-line bounce is a continuation signal where bitcoin trading price bounces off this bitcoin trend line to continue moving in the same direction. In a downwards btcusd crypto trend, the btcusd trading market will bounce downward after hitting this bitcoin trend line level which is the resistance level. In an upward bitcoin crypto currency trend, the btcusd trading market will bounce up-ward after hitting this bitcoin trend line level which is the support level.
The bitcoin crypto currency trend-line break is a reversal cryptocurrency signal where the btcusd trading market goes through the bitcoin trend line and starts heading in the opposite trend direction. When a up bitcoin trend is broken then the sentiment of the btcusd trading market reverses & becomes bearish and when a down bitcoin trend is broken then the btcusd market sentiment reverses and becomes bullish.
For very strong btcusd crypto trends, after this bitcoin trend line break signal, the bitcoin trading price will consolidate for some time before moving in the opposite trend direction. For short term bitcoin trends then this bitcoin trend line break signal will mean bitcoin price may reverse direction immediately.
In bitcoin crypto currency trading, both the bitcoin trend line bounce & the bitcoin trendline break that are used in trading analysis charts are based upon these bitcoin trend line levels being support & resistance areas.
Entry, Exit & Setting stops:
This bitcoin trend line trading method is used to determine good entry and exit points, protective stops are placed just above or below these bitcoin trend lines. The bitcoin trend line bounce is a low-risk entry method used by traders to place entry trades after bitcoin trading price has retraced. Bitcoin trades are setup along these bitcoin trend line levels and a stoploss order placed just above or below these bitcoin trend lines.
The bitcoin trend line break is a crucial technical indicator of possible bitcoin trend reversal. When the bitcoin trend line is broken the bitcoin trading price begins to move in opposite trend direction. This provides an early exit signal for traders to exit their open trade positions & take profits. When there a penetration of these bitcoin trend line levels, it is a signal that the bitcoin trading price can start heading in the opposite trend direction.
Unlike other trading analysis indicators there is no formula used to calculate the bitcoin trend line, this bitcoin trend line formation is just plotted between two chart points on the bitcoin chart.
Study More Tutorials:
- How Do I Analyze Setting up MetaTrader 4 Online BTC USD Software Platform?
- Setting Up MetaTrader 5 Bitcoin Trade Platform Software
- How Do I Download Bitcoin Trade MetaTrader 4 App Free?
- MetaTrader 4 Technical Indicators Buy Sell Free MetaTrader 4 Technical Indicators Buy Sell BTC/USD Trading Indicators MetaTrader 4 Download
- No Nonsense Trade RSI Indicator Tutorial Guide


