CCI BTCUSD Analysis and CCI Trading Signals
Developed by Donald Lambert
The Commodity Channel Index measures the variation of a commodity bitcoin price from its statistic mean/statistical average.
This btcusd indicator is an oscillator which oscillates between high levels and low levels
When the CCI is high it displays that bitcoin price is unusually high compared to the its average.
When the CCI is low it displays that bitcoin price is unusually low when compared to the its average.
BTCUSD Analysis and Generating Trading Signals
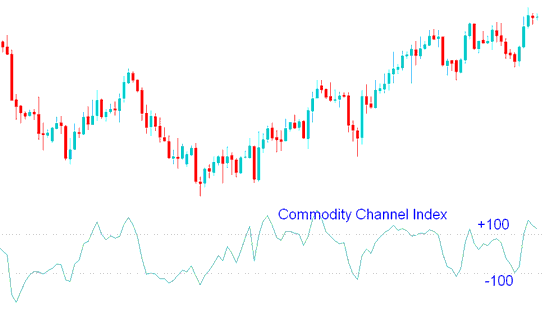
Overbought/ Oversold Levels
The Commodity Channel Index CCI typically oscillates between ±100.
Indicator values above +100 indicate an overbought conditions & an impending market correction.
Indicator values below -100 indicate an oversold conditions and an impending market correction
Buy Trade Signal
If the Commodity Channel Index CCI trading indicator is over-sold, levels below -100, then there is a pending market correction.
Oversold areas will remain intact until CCI trading indicator starts to move above -100.
When bitcoin price starts moving above -100 then that's interpreted as a buy.
The Commodity Channel buy cryptocurrency signal should be combined with a bitcoin trendline break signal to confirm the buy.
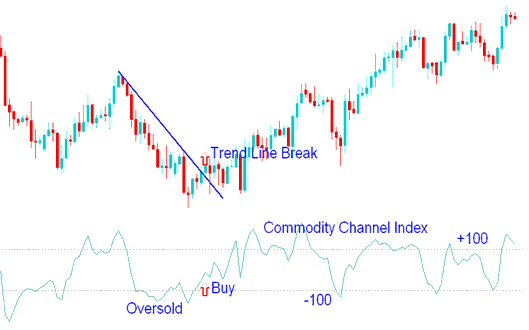
Buy Trade
Sell Signal
If the Commodity Channel Index (CCI) is over bought, areas above +100, then there is a pending market correction.
The over bought areas will remain intact until CCI trading indicator starts to move below +100.
When bitcoin price starts moving below +100 then that's a interpreted as sell.
This Commodity Channel sell cryptocurrency signal should be combined with a bitcoin trendline break signal to confirm the sell.
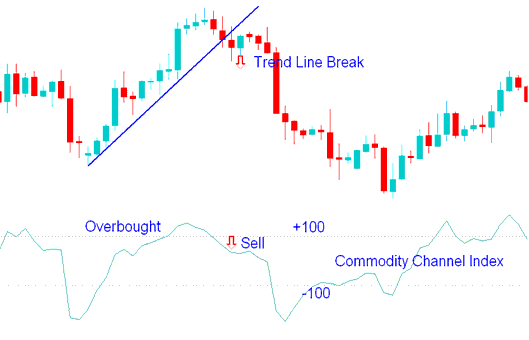
Sell Trade
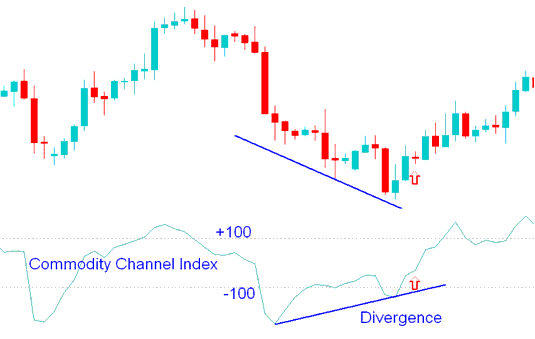
Divergence BTC USD Crypto Trading
Bullish Bitcoin Trade Divergence Setup
Bullish divergence occurs when bitcoin price is making new lows while the CCI is failing to surpass its previous low.
This is a bullish signal because the divergence will be followed by an upwards market correction.
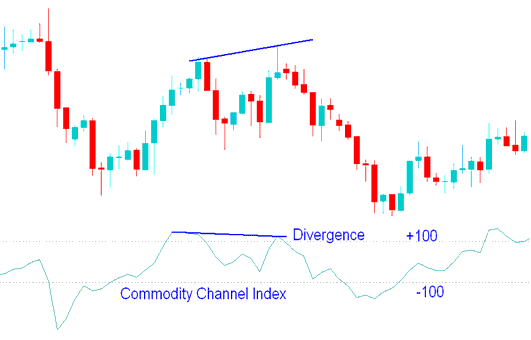
Bearish BTCUSD Trade Divergence Setup
Bearish Divergence occurs when bitcoin price is making new highs while the CCI is failing to surpass its previous high.
This is a bearish signal because the divergence will be followed by a downwards market correction.
Analysis in Bitcoin Crypto Currency Trading
Get More Lessons:
- Step by Step Tutorial for Opening Real Opening Account Procedure
- Continuation Chart Patterns: Ascending Triangle Chart Pattern vs Descending Triangle Chart Pattern Examples
- How Can You Analyze a New BTCUSD Order in MT4 iPad App?
- Types of Different Methods of Bitcoin Trading
- Where Can You Learn BTC USD Technical Analysis for Beginner Traders?
- Types of Oscillator BTC USD Technical Indicators
- How to Use Momentum BTC/USD Technical Indicator on Trading Chart


