Bilateral/Consolidation Cryptocurrency Chart Patterns Bitcoin Trading
With bilateral/consolidation bitcoin trading patterns the btcusd trading market can move in any direction. There are two different types of consolidation cryptocurrency chart patterns which form on charts:
- Symmetric Triangles - Consolidation bitcoin trading chart patterns
- Rectangles - Range market
Consolidation BTCUSD Crypto Currency Patterns
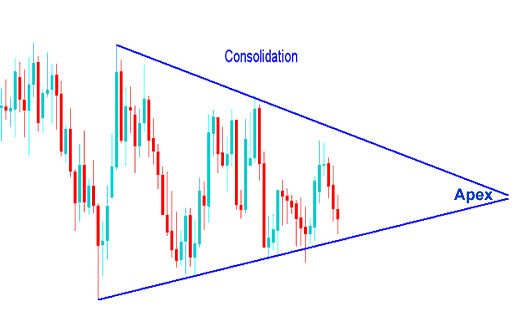
Symmetrical triangles are cryptocurrency chart patterns with converging bitcoin trendlines which form a consolidation period. The technical buy point from a symmetrical triangle is the upwards break, while a down-side break is a technical sell crypto signal. Ideally, a market breaks-out from a symmetrical triangle prior to reaching apex of the triangle.
Bitcoin Trend-Lines can be drawn by connecting the lows and highs of the trading consolidation phase, the btcusd crypto currency trend lines formed are symmetric and converge to form an apex. A breakout should occur somewhere between 60-80% into the triangle cryptocurrency chart pattern. An early or late breakout is more liable to fail, & thenceforth less reliable. After a btcusd crypto currency price breakout the apex forms support & resistance zones for the bitcoin price. Bitcoin Price that has already broken out of the consolidation chart pattern should not retrace past the apex level. The apex level is used as a stop loss setting area for the open Bitcoin trades.
When these consolidation trading chart patterns form we say that the btcusd market is taking a pause before deciding which is the next direction to take.
These consolidation chart patterns form when there's a tug of war between the buyers & the sellers & the btcusd market can't decide which way to continue.
Consolidation Bitcoin Pattern
However, this trading chart pattern can't go on forever & just like in a tug of war one side will eventually win, looking at the cryptocurrency chart below see how the consolidation eventually had a breakout & moved in one direction. Now how do we ensure that we are on the winning side?
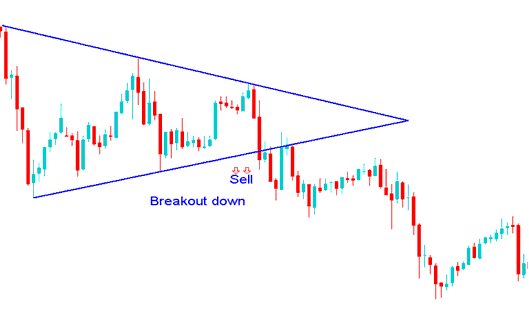
Break out Downward Sell Bitcoin Signal after a Consolidation Pattern
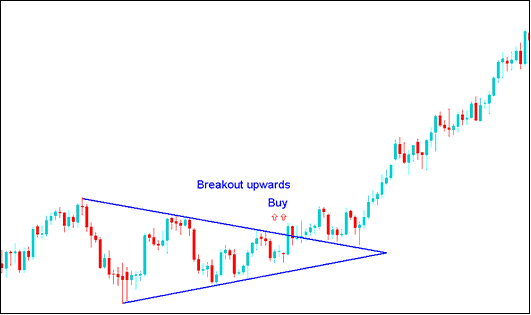
Breakout Upward Buy Bitcoin Signal after a Consolidation Pattern
Now back to the question, how do we make sure we are on side that's winning?
Well we wait til bitcoin price goes past one of the lines and put buy or sell trade orders in that particular direction. After consolidating, If bitcoin price breaks out upper line we buy, if it breaks-out lower line we open sell.
Alternatively if you do not want to wait out the consolidation pattern, you can use pending cryptocurrency orders. If you'd want to learn more about pending orders navigate to lesson: Stop Entry Bitcoin Order Types
The two types of stop order types used to trade consolidation bitcoin trading patterns are:
- Buy Entry Stop An order to open buy at a level above btcusd trading market bitcoin price.
- Sell Entry Stop An order to sell at a level below btcusd trading market bitcoin price.
These are cryptocurrency orders to open buy above the btcusd trading market or to open sell below the btcusd trading market.
Rectangle BTCUSD Pattern
A rectangle consolidation trading chart pattern is a trading range with a thin bitcoin price action that develops a consolidation phase in btcusd market. The price range is defined by two parallel bitcoin trend lines which are horizontal & indicate the presence of support and resistance. This bitcoin pattern is drawn on a cryptocurrency chart using a rectangle, henceforth the name rectangle bitcoin chart pattern.
For this consolidation cryptocurrency chart pattern, bitcoin price forms multiple highs and lows which can be connected with horizontal bitcoin trend lines which are parallel to each other. This bitcoin pattern occurs over an extended period of time, giving the chart pattern its rectangle shape.
A break out of bitcoin price action from this consolidation chart pattern occurs when either of the horizontal line is penetrated & the trading range of the rectangle is broken. An upside breakout is a buy crypto signal. A downside breakout is a sell bitcoin signal.
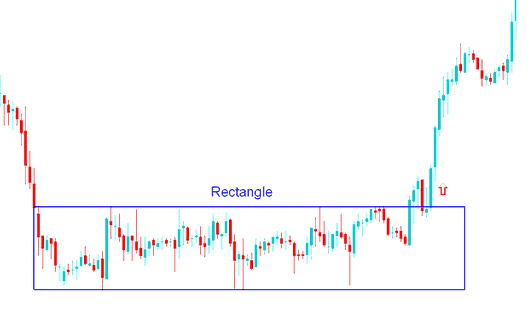
Rectangle Pattern Cryptocurrency - Consolidation Pattern
Bitcoin Price Breaks the consolidation range after sometime & continues to move upwards after an upward market break-out.
Study More Topics and Lessons:
- MT4 Opening a BTC/USD Trading Chart Tutorial Course
- How Can You Trade Bitcoin & Open a Live MT5 BTC USD Account in MT5 Software?
- Money Management Strategies & Tools of Trading Money Management
- Chandes Trendscore Bitcoin Indicator Trading Analysis in BTCUSD
- What Happens in Bitcoin Trading after a Ascending Triangle Chart Pattern?
- What is the Difference between Buy Limit BTC USD Order & Buy Stop Bitcoin Order?
- What Happens to Bitcoin Price Action After Falling Wedge Chart Pattern?
- What Happens in Bitcoin Trading after a BTC/USD Chart Pattern Breakout?
- Day Trade Bitcoin Trendlines BTC USD Strategy
- How to Draw Candles Trade Charts in Trading Charts


