Divergence Bitcoin Setups - Trading Bitcoin Using Divergence Trade Setup
Divergence is one of the trade setups used by Bitcoin traders to analyze prices of BTCUSD Crypto Currency and try to predict the next likely direction of Bitcoin prices. It involves looking at the Bitcoin price chart and one more technical indicator. For our example we shall use MACD indicator.
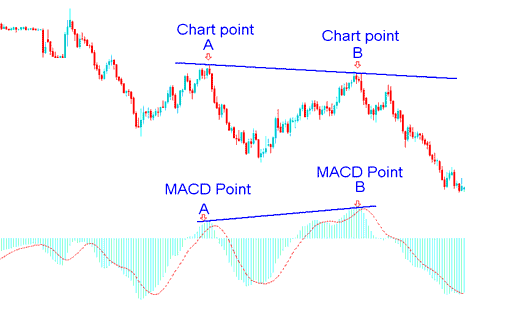
To spot this divergence setup find two chart points at which price makes a new swing high or a new swing low but MACD indicator doesn't, indicating there is a divergence between the price & the momentum.
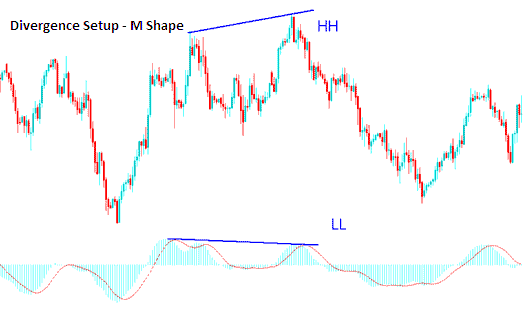
To look for divergence setups we look for two chart points, 2 highs that form an M-shape on the BTCUSD price chart or two lows that form a W Shape on the BTCUSD price chart. Then look for the same M-shape or W Shape on the indicator that you use to trade.
Example of a Bitcoin Price Divergence Trading Setup:
In the BTCUSD chart below we spot two chart points, point A and point B (swing highs). These two chart points form an M shape on the price chart.
Then using the MACD indicator we check the highs made by the MACD technical indicator, these are highs that are directly below Chart points A & B.
We then draw one line on the Bitcoin Crypto Currency chart and another line on the MACD indicator as shown below.
Bitcoin - Divergence Setup - Drawing Divergence Lines
The BTCSUD price chart above shows an example of one of the 4 types of divergence setups, the one above is known as hidden bearish divergence, one of the best types to trade. Various types of divergence setups are covered in the next lesson.
How to Spot Divergence Trade Setup
In order to identify a Bitcoin divergence signal we look for the following:
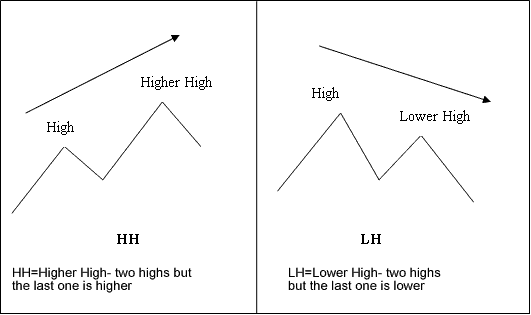
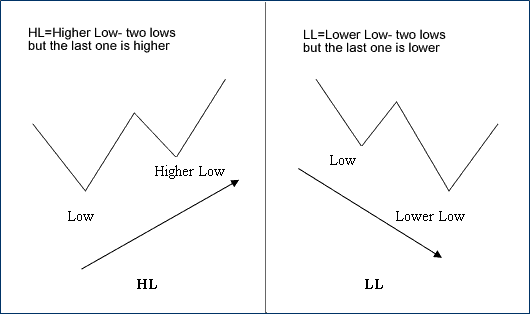
HH = Higher High - 2 highs but last is higher, LH = Lower High - two highs but last is lower, HL = Higher Low - 2 lows but last is higher, LL = Lower Low - two lows but last is lower
First let us look at the illustrations of these terms:
M-shapes dealing with Bitcoin price Highs
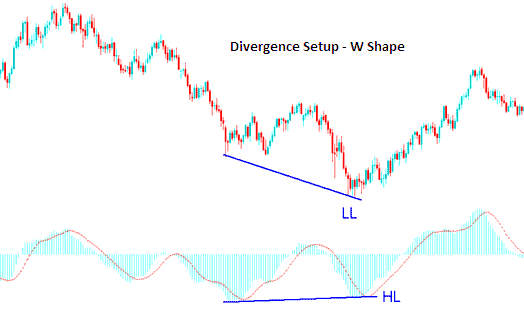
W Shapes dealing with price lows
These concepts above are explained below using BTCUSD Crypto Currency price charts and MACD indicator.
Example of M Shapes on Bitcoin Price Charts
Example of W Shapes on Bitcoin Price Charts
Now that you've learned the divergence terms that are used to explain the divergence setups. Let us look at the 2 types of divergences and how to trade these setups on BTCUSD Crypto Currency price charts.
There two types are of divergence setups:
- Classic BTCUSD Divergence
- Hidden Bitcoin Divergence
These two divergence setups are explained on the next guides.
Study More Topics and Courses:
- How to Use MT5 Android BTC USD App Tutorial Guide for Beginner
- What is a BTC/USD Demo Trading Account?
- Bitcoin Trading Live Account Opening Tutorial Guide
- Procedure for Register BTC USD Account Procedure of Register BTC USD Account
- How Can You Trade Bitcoin & Place a Pending BTCUSD Order in MT5 iPhone Trading App?
- How Can You Draw Fibonacci Pullback in MT4 Platform?


