Drawing Downward Trendlines and Channels
A Downwards trend line is a line drawn on the Bitcoin Crypto Currency chart when the general trend of the prices is moving downwards & thenceforth this line is drawn above these downwards trending prices by connecting at least two highs of the downward price trend. This line will show the general trend of the market to be downwards.
The example below explains this concept and explains how prices move when in a downwards trend. When the market is moving downward it keeps forming new resistance areas as it moves downwards & these resistance levels are the ones used to draw the downwards trend line.
Because the market heads in a zigzag manner, BTCUSD traders will normally draw a trend which shows the general downwards trending direction.
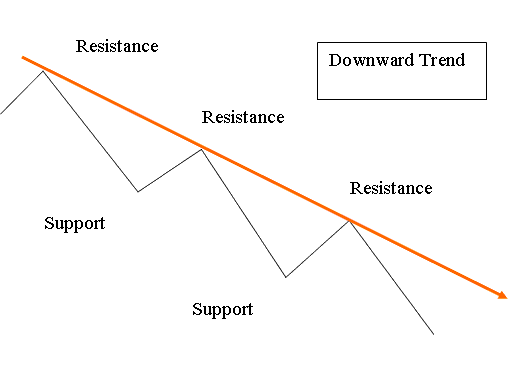
Down-ward Trending Market
A downwards trend occurs when the price of Bitcoin makes a series of lower lows and lower highs. Each price high is going to be lower than the previous high - lower high and each low is lower than the previous low - lower low therefore showing bearish Bitcoin price movement.
Downward trendlines gain more validity each time price touches these lines but doesn't penetrate the line. A downtrend remains the general direction until this series of lower highs & lower lows is broken.
In trading analysis, an up side penetration of a downward trend-line is a trading buy signal, and usually the first indication that the bearish direction of Bitcoin prices may soon reverse or at least start to consolidate.
Drawing a Downward Trend Line on Bitcoin Price Chart
When the online Bitcoin Crypto market moves down it forms lower lows and lower highs forming a bearish market movement. A downward trendline can then be drawn by connecting these lower highs.
To draw this setup we use resistance levels made by the Bitcoin prices. To draw a downward trend line correctly two resistance levels are needed. When price touches this downward trend-line we buy & place a stoploss order just a couple of pips above this trend-line. The diagram below shows an example of a downward trend-line.
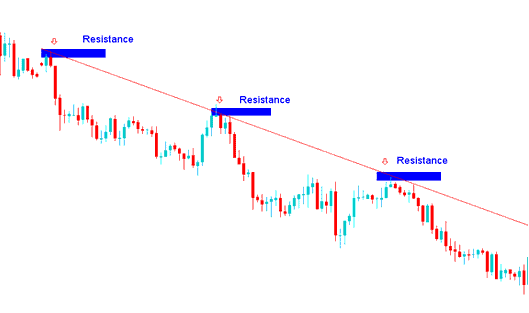
Down-ward Trend Line - Bitcoin Trading
The trend line setup will show the general direction of the Bitcoin market as bearish therefore traders will only open sell trades as long as price movement is within this setup and within the resistance levels. These are the levels where if the market retraces then these points will provide strong resistances for the price. This is why many sellers will wait til price rallies upwards and hits these retracements levels to open sell trades. Trades opened at these levels have a very high Risk: Reward Ratio & are very profitable.
In the above setup a trader would have opened sell/short trades from the signals generated at the resistance1, resistance2, resistance3 and these trades would have made a lot of profits with minimum amount of draw-down/retracement. This is why many Bitcoin traders like to trade using this trend-line trade setup.
Drawing Downwards Channel
A downwards channel is drawn by plotting a line that is parallel to the Downward trend line & then this new line is adjusted to touch the bottom boundary of the Bitcoin price movement. This then forms a channel of the price and as long as a price stays between these two channels the bearish market movement of Bitcoin prices will continue heading down.
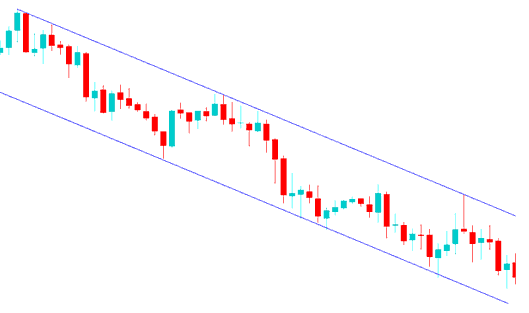
Down-ward Channel - Bitcoin Trading
Trading the Downward Bitcoin Prices Channel
This Downwards channel is used by Bitcoin traders to show levels where it best to take profit orders. Bitcoin BTCUSD traders will take some profit once the price touches the lower channel and wait for another retracement before opening another sell trade again.
MetaTrader 5 Tools for Drawing Downwards Trend Line and Channels
The tools to plot these trend line setups on the MT5 are located on the MetaTrader 5 lines drawing toolbar within the MetaTrader 5 platform - to access this toolbar if it isn't activated on your Bitcoin MT5 platform, Click in 'View' Next to the 'File' at the left top corner of MetaTrader 5 and click 'View', Then Click on 'ToolBars', Then Tick and choose the "Lines ToolBar" by clicking on it.
Shown Below is the screen-shot of the MetaTrader 5 trend-lines drawing toolbar. To draw a trend line on a BTCUSD Crypto Currency chart just click on this tool and select the point where you as the trader want to draw.
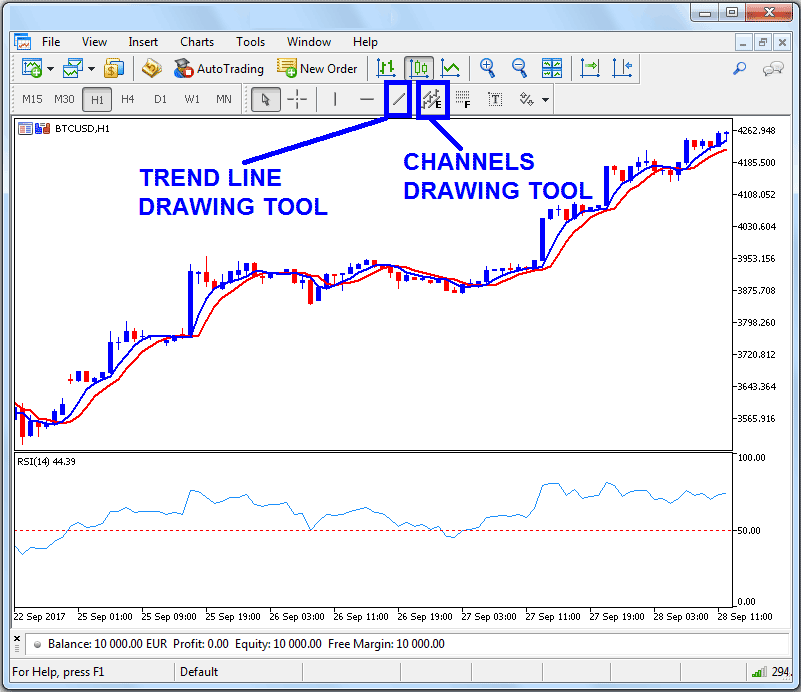
MetaTrader 5 Toolbar for Drawing Downwards Trend Line and Channels
Learn More Tutorials and Lessons:
- Download Bitcoin Trade App for iPad
- How Do I Save a MT5 Trading BTC USD Chart Template in MetaTrader 5 Platform?
- How Do I Analyze BTC USD Strategies Guide?
- How to Analyze Chart Trading Analysis Using Market Trend
- How Do I Add Bitcoin Trade MetaTrader 4 Expert Advisor Automated Expert Advisor Bot in MetaTrader 4 Platform?
- How Do I Create a MT4 Trading Account to Trade?
- How to Practice Trade BTC USD in MetaTrader 4 Bitcoin Demo Practice Account
- How Do I Trade in MetaTrader 4 Trading Platform?
- How Do I Draw Upward BTCUSD Channel in MetaTrader 5 Bitcoin Charts?


