Fibonacci Drawing on Bitcoin Charts Exercises
These exercises will give more examples on trading and drawing Fibonacci retracement levels and Fib expansion levels. The first exercise is to determine the direction of the Bitcoin price trend & then determine if the Fibonacci tool used is Fibonacci retracement or Fibonacci expansion and then figure how it is drawn then practice drawing them on a Bitcoin Crypto Currency chart using a practice demo account.
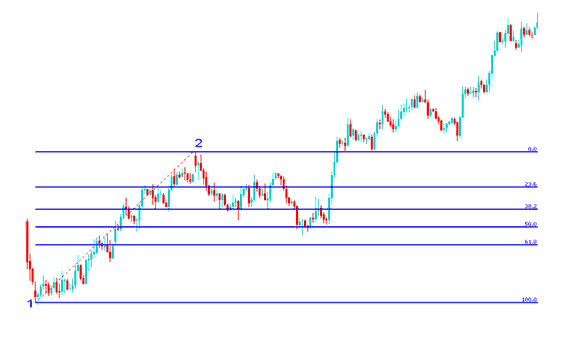
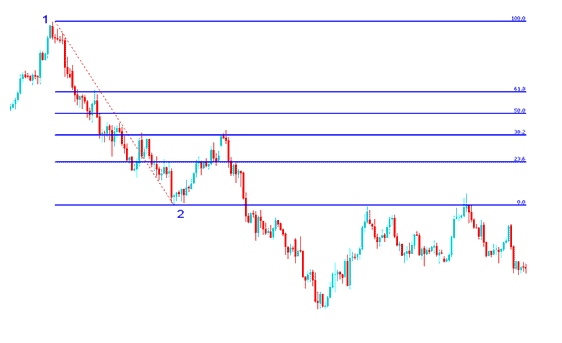
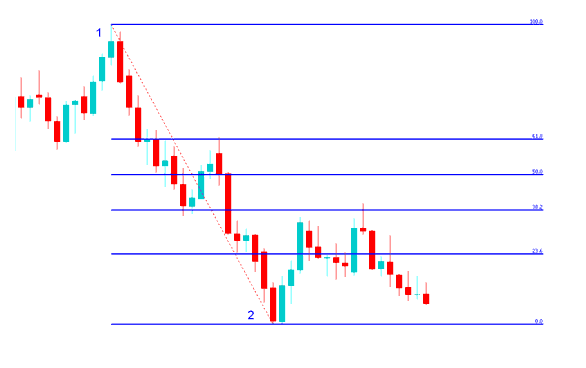
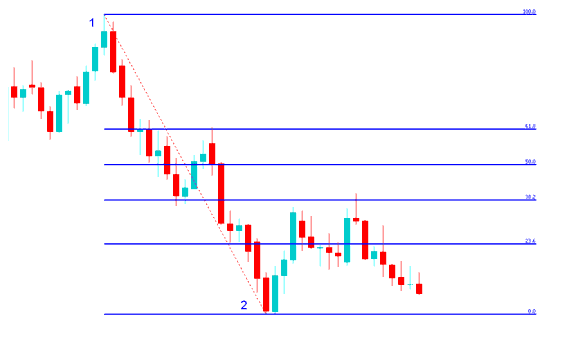
Tasks:Figure out the direction of the Bitcoin price trend
Determine if the Fibonacci is retracement or extension
Figure-out how it is drawn
Practice drawing Fibonacci retracement or Fibonacci expansion on a BTCUSD Bitcoin price chart.
To find BTCUSD Bitcoin charts just download MetaTrader 5 platform from any one of the many online brokers & choose the financial instrument - BTCUSD.
After you've downloaded the MetaTrader 5 platform, Go to the menu 'Insert' at the top left corner, on the dropdown menu, click Fibonacci & select either the option of Fibonacci Retracement or Fibonacci Expansion. Then draw it as explained in the previous courses of Fibo Expansion and Fibonacci Retracement. Then do the following exercises:
Fibonacci Retracement Levels and Fibo Extension Levels Exercise
Training Exercises 1:
Exercises 2:
Training Exercises 3:
Exercises 4:
Exercises 5:
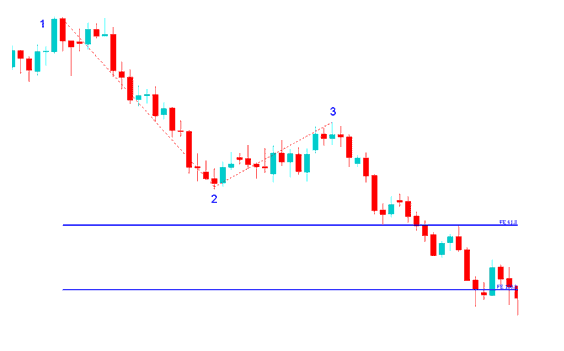
Hint: point 1 to point 2 follows the market trend direction
Hint: Fibo Retracement has points 1 & 2
Hint: Fibo Extension has point 1, 2 and 3
More Courses and Lessons:
- How Do I Analyze a Good Stop Loss BTC USD Order Setting Percent?
- How to Generate Buy Bitcoin Signals & Sell What are BTC USD Signals
- How Do I Analyze BTC USD Channel Indicator on BTC USD Charts?
- BTC USD Trade MetaTrader 4 App for Android
- How Do I Identify a Rising Wedge BTC USD Pattern in BTC USD Trade?
- Introduction Guide for Trading MetaTrader 5 Mobile Trade App
- How Do I Analyze a BTCUSD Trade Guide Course Guide?
- How to Open a Sell Stop BTC USD Order Trade on BTC USD Platform Software
- How to Open Demo Practice Account in MetaTrader 4 Trading Platform Tutorial Guide


