How Do You Draw Bitcoin Fib Retracement Areas on a Upwards Bitcoin Trend?
How Do I Trade Bitcoin and Draw Bitcoin Fib Retracement Areas on a Upwards Bitcoin Trend?
Traders use Bitcoin Fib retracement tool to determine where to place a buy bitcoin trade in a upward trend.
How Do I Draw Fibonacci Retracement on a Upward Bitcoin Trend?
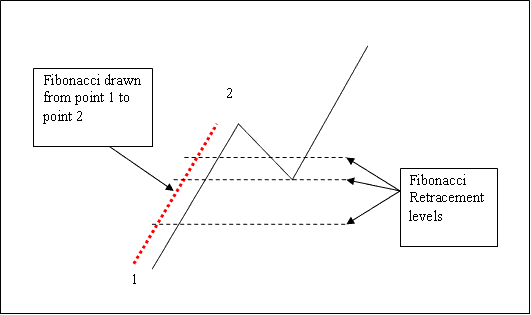
To Draw the Bitcoin Fibo retracement tool the first thing to know is that this Fibonacci Retracement indicator tool is always drawn in direction of the trend.
If the bitcoin trend is down ward - Fibonacci Retracement indicator is drawn downwards.
How Do I Draw Bitcoin Fibo Retracement in an Upwards Bitcoin Trend?
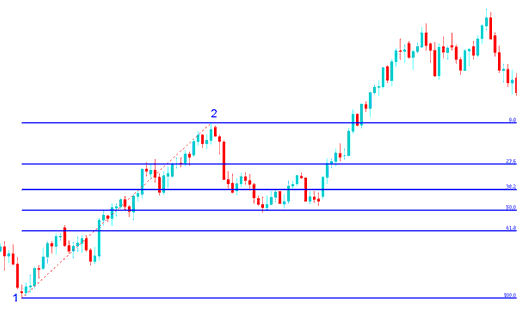
In the bitcoin analysis example illustrated below of how to draw Bitcoin Fib Retracement bitcoin indicator the bitcoin price is moving up between chart point 1 & cryptocurrency chart point 2 and then after chart point 2 bitcoin price retraces down to 50.0% Bitcoin Fibo retracement level then it continues moving upwards in the original upward trend. Note that this Bitcoin Fib Retracement bitcoin technical indicator tool is plotted from chart point 1 to point two in the direction of the bitcoin trend (Up-ward Direction).
How Do I Draw Bitcoin Fib Retracement on Upward Bitcoin Trend
Analysis of How Do I Draw Bitcoin Fibo Retracement in an Upwards Bitcoin Trend?
Once the bitcoin price got to the 50.0% Bitcoin Fibonacci retracement zone, this Bitcoin Fibonacci retracement zone provided a lot of support for the bitcoin price, and afterward btcusd crypto price then resumed the original upwards btcusd crypto trend and continued to move up.
For this Fibonacci retracement trading analysis example of how to draw Bitcoin Fib Retracement bitcoin indicator on an upward bitcoin crypto currency trend, the bitcoin price retracement reached the 50.0 percentage% Bitcoin Fibonacci retracement zone, but most of the time the bitcoin market will retrace up to 38.2% Bitcoin Fib retracement level & therefore most of the time bitcoin traders set their buy limit bitcoin orders at the 38.2% Bitcoin Fibonacci retracement zone, while at the same time placing a stop loss bitcoin order just below 61.8% Bitcoin Fibonacci retracement zone.
Tutorial of Trading Cryptocurrency Draw Fibonacci Tool on Bitcoin Crypto Currency Charts
Tutorial of Trading Cryptocurrency Draw Fibonacci Tool on Bitcoin Crypto Charts
How Do I Draw Bitcoin Fib Retracement Areas on a Upwards Bitcoin Trend?
Get More Lessons and Topics:
- What's the Difference Between BTC USD Cent & Standard Bitcoin Account?
- How to Add Bitcoin Automated Expert Advisors on the MetaTrader 4 Platform
- MetaTrader 4 Demo Free BTC USD Practice Account
- BTC USD Analyze & Place a Sell Stop BTC USD Order on MetaTrader 4 Platform
- How to Calculate Where to Place Stop Loss Order on a Trading Chart
- Linear Regression Acceleration BTC USD Trade MetaTrader 4 Technical Indicator
- What's the Difference between BTC USD Fibo Pullback & Bitcoin Fibo Extension?
- How to Trade with Trading Mobile MetaTrader 5 Trading App Guide
- MetaTrader 4 Bitcoin Platform Software Tutorial Candlesticks Chart Analysis BTC USD Trade Tutorial Course
- BTC USD Trade Real Account Open NDD


