How to Read a Candlestick Chart
A beginner traders tutorial to trading - how to read charts. The 3 types of charts are line crypto chart, bar chart & candlestick chart - these commonly used chart types are covered in this tutorials & beginners can learn how to interpret these charts from this tutorial.
This learn bitcoin trading tutorial will show you how to read these crypto candlesticks charts that are commonly used in the Bitcoin market.
How to Read Candle BTCUSD Charts for New Traders
Line Charts - cryptocurrency line crypto charts draws a continuous line connecting closing bitcoin prices of bitcoin crypto.
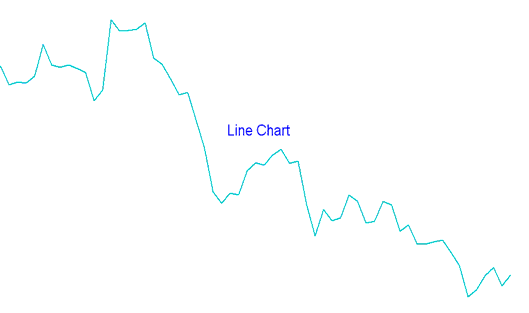
Bitcoin Line Charts - How to Read Candlestick Bitcoin Charts for New Traders
Bars Charts - btcusd crypto currency trading bar charts are shown as sequence of O-H-C-L bars. O.H.C.L. represents OPEN HIGH LOW and CLOSE. The Opening btcusd crypto currency price is displayed as a horizontal hyphen on the left & closing btcusd crypto currency price as a horizontal hyphen on the right.
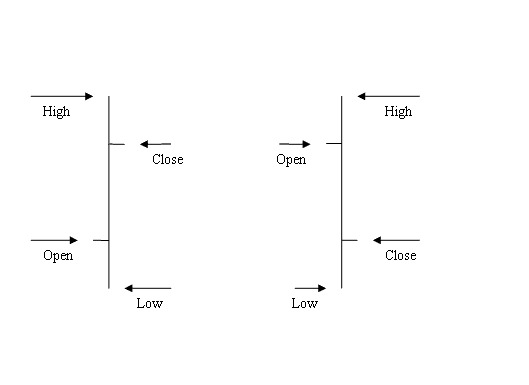
Bitcoin Bars Charts- How to Read Candlestick Bitcoin Charts for New Traders
Main disadvantage of a bar charts is that it isn't visually appealing, therefore most traders do not use them.
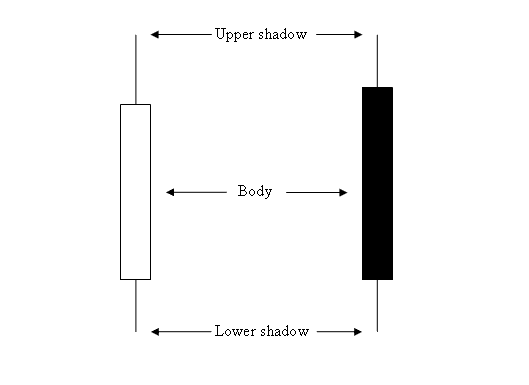
Candles BTCUSD Crypto Currency Charts - these crypto candlesticks charts use the same bitcoin price data as bar charts (open, high, low, and close). However, they are represented in a much more visually identifiable way which resembles a candle that has wicks on both its ends.
How to Analyze Candles BTCUSD Crypto Currency Charts
The rectangle section is called the body.
The high & low are described as shadows & drawn as poking lines.
How to Read Candlestick Charts for New Traders
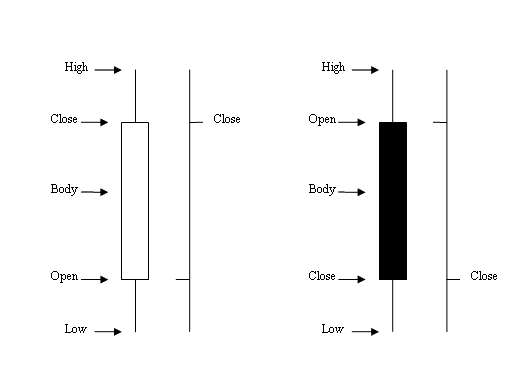
The colour of the bitcoin crypto currency trading candlestick is either blue or red:
- (Blue or Green Colour Candles) - Bitcoin Prices moved up
- (Red Colour Candles) - Bitcoin Prices headed down
Most bitcoin softwares like the MT4 BTCUSD Crypto Currency Software, use colours to mark direction of the bitcoin price. Candles color used are blue or green: when btcusd crypto currency price moves up, color of candle is blue: when bitcoin price moves down, color of candlestick is red.
How to Read Candle BTCUSD Charts for Beginners
When Bitcoin candles charts are used it's very easy to see if the bitcoin price headed up/down as compared to when bar charts are used.
More Lessons and Tutorials:
- How Does Online BTCUSD Trading Work?
- How Can You Use Trading Buy Stop Order in MT5 Trade Software?
- How Can You Draw Upwards Trend Line in Trading Charts in MT4 Platform?
- How Can You Analyze More Bitcoin Trading Charts in MT4 Platform?
- What are the Top Bitcoin Trading Strategies Guide?


