How to Day Trade Bitcoin with Pivot Points
Pivot Points are used by traders to find support and resistance areas based on the previous day's Bitcoin prices.
Pivot points technical indicators uses the previous day's high, low and closing price to project support and resistance levels for future Bitcoin prices.
Pivot Points indicator provides an idea of where key support and resistance areas should be. Once a trader places this indicator on the BTCUSD chart, the resistance and support levels of Bitcoin prices will be plotted on the BTCUSD Bitcoin chart. These support and resistance levels are used by Bitcoin traders to determine market tops, market bottoms & also levels where the market trend is likely to reverse or retrace.
Daily Pivot Points are calculated from the previous day's high, low & closing prices. The Pivot Points indicator is illustrated below.
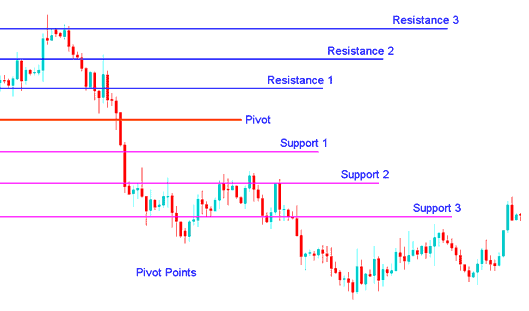
Pivot Points Indicator - Bitcoin Trading
Analysis of Pivots
The central pivot point is primarily used to determine the market trend.
The other support & resistance areas are also important in calculating levels that can generate significant market movements.
Pivot Points Indicator can be used in Two Ways:
The first method is for determining the general Bitcoin price trend:
- If the pivot point is broken in an upward trend movement, then the market is bullish
- If the pivot point is broken in a downward trend movement, then the market is bearish
However, Bitcoin traders should note that pivot points are short term trend indicators, useful only for one day until they need to be recalculated.
The second method is to use these pivot points to enter & exit trades. This btcusd indicator is very useful when it comes to calculating the areas that are likely to cause price movements and traders can then use these points to determine whether to open a trade or to close a trade.
Trading signals generated using pivot points indicator should also be used together with another indicator so as to confirm these signals.
Other indicators which can be combined with Pivot Point indicator are Moving Averages, MACD and RSI.
The example below shows the Moving Average indicator which can be combined with pivot point indicator to confirm the signals generated by the pivot point indicator.
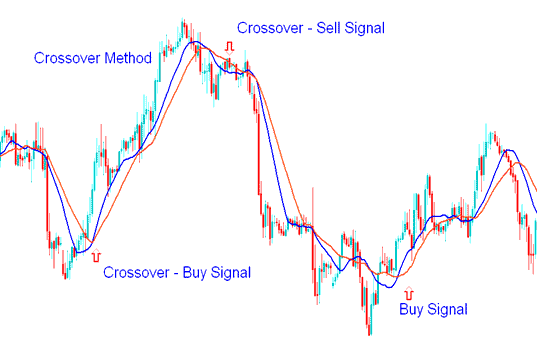
MA Indicator - MA Cross-over Strategy
These MAs can be used to confirm the direction of the continuing price trend or they also can be used to confirm a price reversal setup. Once a signal is generated by the pivot point indicator then a trader will use the moving average indicator to confirm the signal. If both indicators give a signal in the same direction then a trader can open a trade - if not a btc usd trader should wait until the signal generated by the pivot point indicator is confirmed by the Moving average crossover system shown above.
Pivot Points Trading Setups
Trend Continuation Trading: The central pivot point is useful in determining the general trending direction of the prices of BTCUSD Crypto Currency (BTCUSD). Trades are only opened in direction of the current trend. A buy signal occurs only when the market is above the center pivot point & a sell trading signal occurs only when the market is below the central pivot point.
Price Breakouts Trading: A bullish signal forms when the market breaks up through the central pivot point or one of the resistance levels (typically Resistance Level 1). A bearish signal forms when the market breaks down through the central pivot point or one of the support levels (typically Support Zone 1).
Trend Reversals:
- A buy signal forms when market price moves towards a support zone, gets very close to this point, touches this point, or moves only slightly through this point, & then reverses and moves back in the opposite upward direction.
- A sell signal forms when market price moves towards a resistance area, gets very close to this point, touches this point, or moves only slightly through this point, and then reverses & moves back in the opposite downwards direction.
Stop loss and/or Take Profit Values Determined by Pivot Point Support/Resistance Levels: Pivot point technical indicator is helpful in determining suitable stop loss order and/or takeprofit levels. For example, if trading a buy long signal generated by a break-out above the Resistance 1, it may be reasonable to position a stop loss just below the central pivot point or just below.
Get More Lessons:
- MT4 Parabolic SAR BTC/USD Technical Indicator for Day Trade
- How to Register Practice Account in MT4 Trading Software
- Hull Moving Average MA BTC/USD Technical Indicator
- How Can You Trade Bitcoin Price with Different Chart Time frames?
- How Can You Identify a Symmetrical Triangle Bitcoin Pattern in BTCUSD Trading?
- MT5 BTC USD Charts Options Settings on Tools Menu
- Acceleration/Deceleration (AC) AC BTC/USD Technical Indicator
- BTCUSD Cent Account Cent BTC USD Brokers with BTC USD Cent Accounts
- How Can You Analyze Fibo Pullback Levels Trading Analysis?
- How Can You Login in to MT5 Trade Account?


