RSI Bitcoin Indicator Divergence Bitcoin Trade Setups
Bitcoin Divergence is one of the trade setups used by Bitcoin traders. It involves looking at a chart & one more indicator. For our example we shall use the RSI indicator.
To spot this divergence setup find two chart points at which bitcoin price makes a new swing high or a new swing low but the RSI cryptocurrency indicator doesn't, indicating a divergence setup between bitcoin price & momentum.
RSI Bitcoin Divergence Example:
In the chart below we spot two chart points, point A & point B (swing highs)
Then using RSI technical indicator we check the highs made by the bitcoin RSI technical indicator, these are highs that are directly below the bitcoin Chart points A and B.
We then draw one line on the chart and another line on the RSI.
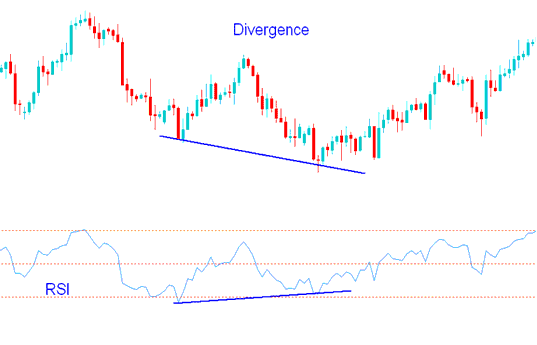
RSI Divergence Bitcoin Setup - Bitcoin Trade Divergence using RSI Crypto Technical Indicator
How to spot bitcoin divergence
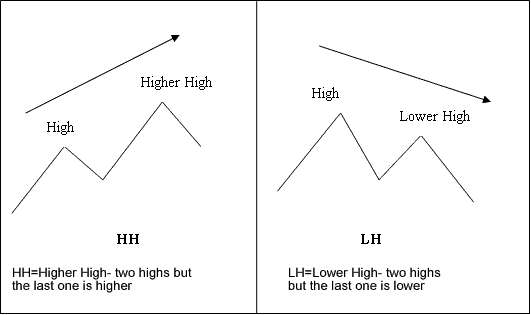
In order to identify this divergence setup we look for the following:
HH = Higher High : two highs but last is higher
LH = Lower High : 2 highs but last is lower
HL = Higher Low : two lows but last is higher
LL = Lower Low - 2 lows but last is lower
First let us look at the illustrations of these bitcoin terms
Divergence Bitcoin Trading Terms Definition
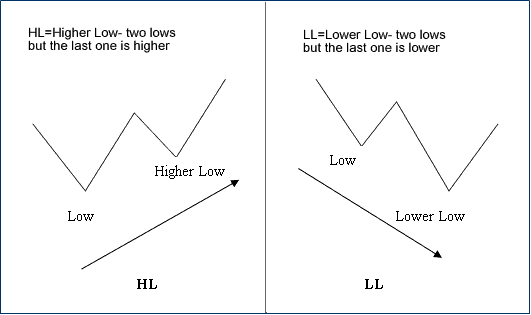
Bitcoin Divergence Terms Definition Examples
There are 2 different types of divergence setups:
- Classic BTCUSD Trading Divergence
- Hidden Bitcoin Trading Divergence
More Topics and Tutorials:
- Where & How to Set Limit BTC USD Orders in Bitcoin Trading
- 3 Types of Stochastic Oscillators BTC USD Strategies
- How to Open MT4 BTCUSD Demo Account
- BTCUSD Technical Indicators & BTC USD Trading Systems
- BTCUSD Trading MT5 Trade Software Market Watch Window for MetaTrader 5 BTC USD Software Symbols List
- How Can You Use Zigzag MT4 Bitcoin Technical Indicator on Trading Chart in MT4 Platform?
- Bitcoin Trading MT5 Charts Tool Bars Guide


