Reversal Chart Patterns Head and Shoulders & Reverse Head and Shoulders
Head and Shoulders Reversal Chart Pattern
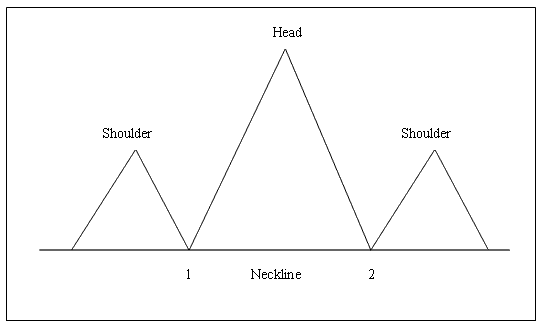
Head & Shoulders Pattern is a reversal pattern that forms after an extended BTCUSD Crypto Currency price upward trend. It's made up of three consecutive peaks, the left shoulder, head & the right shoulder with 2 moderate troughs between the shoulders.
This Head and Shoulders Reversal Pattern is considered complete once price penetrates below the neck line, which is drawn by joining the two troughs in between the shoulders pattern.
To go short, Bitcoin traders set their sell stop orders just below neckline.
Summary:Head and Shoulders Reversal Chart Pattern forms after an extended move upwards
This reversal setup formation demonstrates that there will be a reversal in market price
This formation resembles head with shoulders thus its name.
To plot the neckline we use point 1 & point 2 as illustrated below. We also extend this line in both directions.
We sell when the price of Bitcoin breaks below the neckline: see the chart below for explanation.
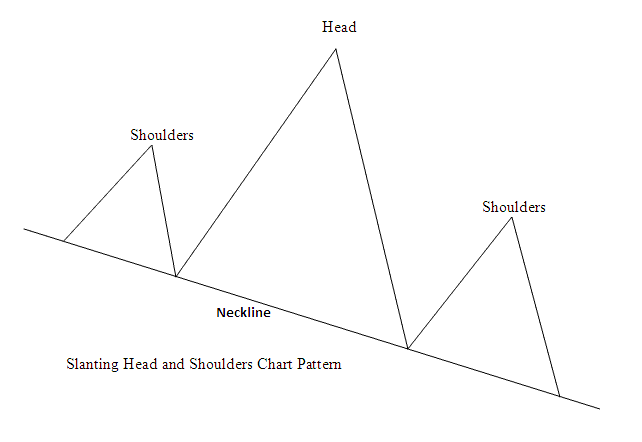
Or the head & shoulders also can form on a sloping neck-line, like the example below:
Example of Head and Shoulders Pattern on a Bitcoin Price Chart
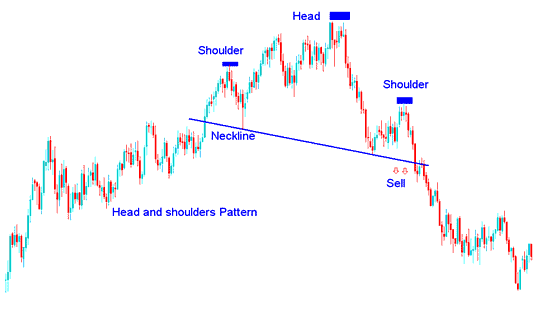
Head and Shoulders Pattern - Bitcoin Trading
Example 2: Head and Shoulders BTCUSD Trading Pattern
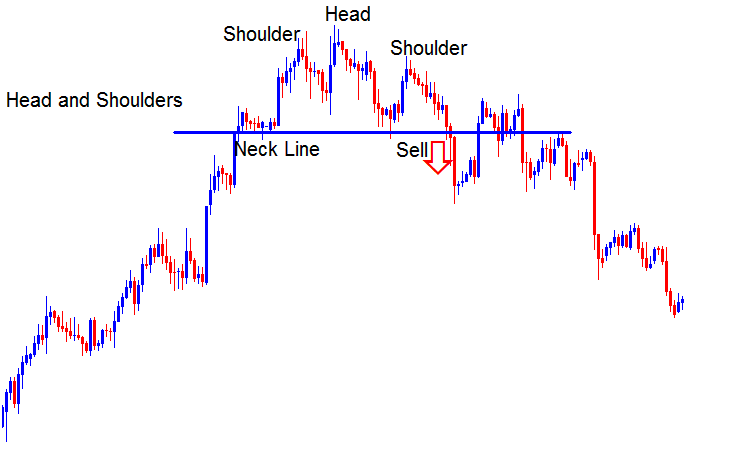
Head & Shoulders Pattern - BTCUSD Crypto Currency Trading
This reversal pattern also can be formed on a sloping neck line, like the one above, the neck line doesn't have to be necessarily horizontal.
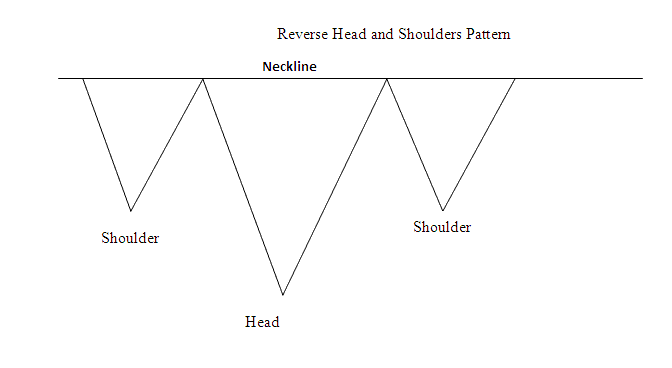
Reverse Head and Shoulders Reversal Pattern
This is a reversal head and shoulders chart pattern that forms after an extended Bitcoin downward trend. It resembles an upside-down head & shoulders pattern.
This Head and Shoulders Reversal Pattern is considered complete once price penetrates above the neckline, which is drawn by joining the two peaks between the reverse head and shoulders pattern.
To go long buyers/bulls set their buy stop pending orders just above the neck-line.
Summary:Reverse Head & Shoulders Chart Pattern forms after an extended move downwards
This formation indicates that there will be a reversal in market price trend
This formation resembles an upside-down head & shoulders pattern, thus its name Reverse Head and Shoulders Pattern.
We buy when the price breaks above the neck line: see the chart below for explanation.
Reverse Head & Shoulders Pattern - BTCUSD Crypto Currency trading
Example of Reverse Head and Shoulders Chart Pattern on a Bitcoin Price Chart
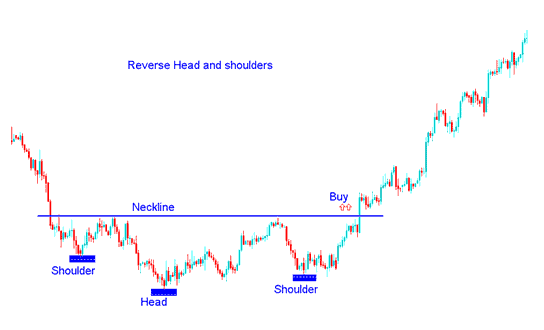
Reverse Head and Shoulders Pattern - Bitcoin Trading
Step2: Reverse Head & Shoulders Pattern - Bitcoin Trading
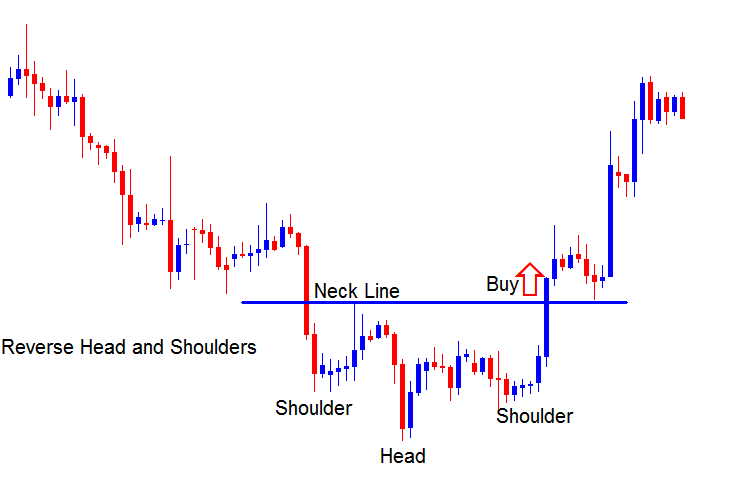
Reverse Head & Shoulders Pattern - BTCUSD Crypto Currency Trading
Learn More Topics and Tutorials:
- How Can You Analyze Fibo Extension on MT5 Software Platform?
- Bitcoin Trading Downwards Trend Trade Technical Analysis
- How Can You Use Buy Stop Order on Trading Software?
- How to Change Chart Time BTCUSD Charts in MT5 Software
- How to Install MetaTrader 5 BTC USD Trading Software on a Computer
- Writing BTCUSD Trading Journal Book
- How Can You Add a Download MetaTrader 4 BTCUSD Trading Robot in MT4 Platform?
- How Can You Analyze MetaTrader 4 Fibonacci Pullback in MT4 Platform?
- How to Read BTC USD Trading Fibonacci Extension Levels Strategies
- Learn BTC USD Training Website Tutorial


