Bitcoin Trendline Break - Trading Trend Line Bitcoin Reversal Signals on Bitcoin Charts
After the price of Bitcoin Crypto Currency has moved in a certain direction for an extended time period within a channel it reaches to a point where it stops moving within this channel. When this occurs we say the trendline has been broken.
Since the trendline is the point of support or resistance then we expect the market to move towards the opposite direction after a trend line break. This is because the support or resistance level that the price has been moving along has now been broken. When this happens traders will close their open orders that they had bought or sold. This is known as profit taking.
Uptrend Reversal - Upwards Trend Line Break
When price breaks an up-wards trend line (support area) the market will then start to move down or start to consolidate at this level before heading down.
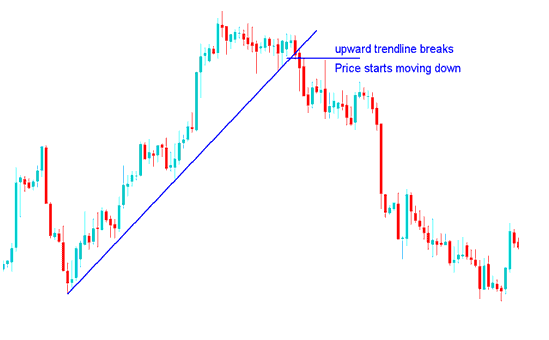
Upward Trend-Line Break
This reversal signal is considered to be complete with the formation of a lower high or a lower low - double tops chart pattern. This also provides a trading opportunity for traders who want to sell Bitcoin - to go short once the upward trend line is broken.
Downtrend Reversal - Downward Trend-Line Break
When price breaks the downward trend line (resistance level) market will then move up or start to consolidate at this level before heading up.
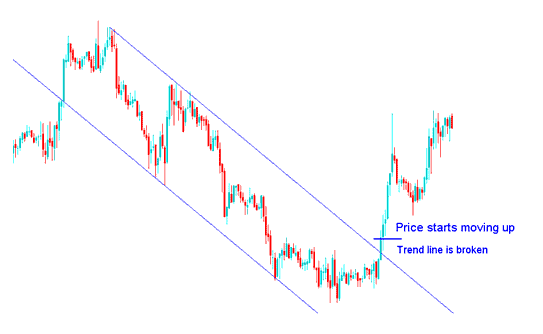
Downward Trend Line Break
This reversal signal is considered to be complete with the formation of a higher low or higher high - double bottoms chart pattern. This also provides a trading opportunity for traders wanting to buy to go long once the downward trend line is broken.
NB: Sometimes when the price breaks its trend line it might first of all consolidate before moving in the opposite direction. Either way it's always good to take profit when the market direction reverses or when the trend line breaks-out.
To trade this trend line reversal setup - as a trader once you open a new trade in direction of the trend reversal the price should move immediately in that direction, in a price breakout manner. This means that the market should soon head in that direction without a lot of resistance.
If on the other hand the market does not immediately move in direction of the price breakout then it is best to close out the trade because it means the trend is still holding and current market direction might continue or at best a price consolidation pattern may form.
Another tip is to wait for the trendline to be broken & for the market to close above or below it so as to confirm this signal.
What happens is most traders open trade transactions waiting for reversal even before the trend is broken, only for the price to touch this trend line and for the prevailing market trend direction to hold and the Bitcoin prices to continue moving in the current market direction.
Hence, when trading this trend line break reversal setup it's best to wait until the breakout has been confirmed by price closing above or below the trendline, depending on direction of the market.
- Upward Market Direction Reversal - this signal is confirmed once the market closes below this upwards trendline, this should be the right time to open a sell short trade, so as to avoid a fake out.
- Downwards Market Direction Reversal - this signal is confirmed once the market closes above the downward trendline, this should be the right time to open a buy long trade, so as to avoid a whipsaw fakeout.
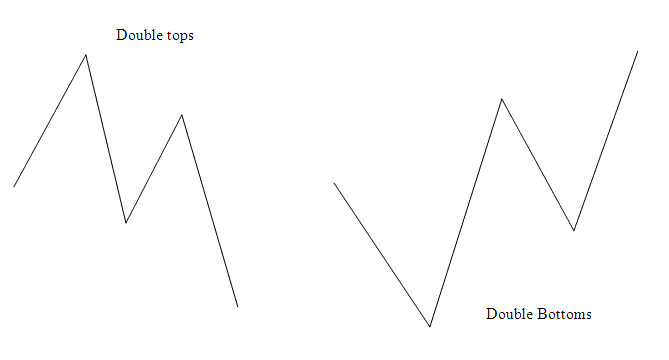
Combining Reversal Signals with Double Tops or Double Bottoms Chart Patterns
A good trade setup to combine this trend line reversal signal with is the double tops and double bottom chart patterns.
This double tops and double bottoms reversal pattern setup should already have formed before the trend line break signal. Because these double top and double bottoms are also trend reversal setups, then combining these two setups will give Bitcoin traders a good probability of avoiding whipsaws.
In the above chart examples these double tops and double bottoms chart pattern setups can be confirmed to have formed even before the trendline reversal signal appeared.
First Example of Upward Trend Reversal - the Double tops chart pattern had already formed before trend break signal formed on the Bitcoin price chart - this can be illustrated by the lower high just before the upwards trend line break.
Second Example of Downwards Trend Reversal - the Double bottoms chart pattern had already formed before trend break signal formed on the BTCUSD Crypto Currency chart - this can be illustrated by the higher low just before the downward trend line break.
Double Tops or Double Bottoms Combined with other Trendline Reversal Signals
Get More Topics:
- Best CCI for 15 Min Bitcoin Chart
- How Can You Add Bulls Power BTC USD Technical Indicator in Trading Chart in MT4 Platform?
- What are the Top Bitcoin Trading Strategies Guide?
- How to Read MetaTrader 5 Crypto Fibonacci Extension Technical Indicator in MT5 Software
- How to Trade a BTC/USD Trend Reversal in Bitcoin Trading
- How Can You Analyze MetaTrader 5 Fibo Extension on MT5 Software?
- How Can You Analyze BTC USD Symbols in MT4 Trading Software?
- How Can You Add Stop Loss BTC USD Order on Bitcoin Software?
- How to Download MetaTrader 4 Bitcoin Software for Windows
- Trading Bitcoin Place a BTC/USD Trade Order in MT5 App


