Ultimate Oscillator Bitcoin Analysis & Ultimate Oscillator Technical Trading Signals
Originally developed and used to trade stocks & commodities markets.
This oscillator aims at striking a balance between leading signals & lagging signals given by the common technical indicators.
- Leading - some indicators lead the btcusd market and give signals earlier than the optimum time
- Lagging - some indicators lag the btcusd market so far that half of the move is over before a signal gets generated.
This is the balance that the oscillator aims to strike, not to lead too much or lag too much - this way the oscillator trading will always give a signal at the ultimate time, thus its name.
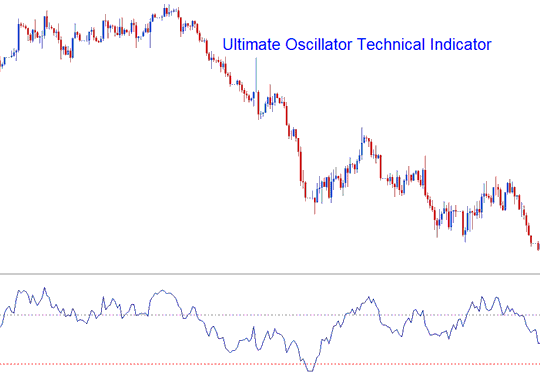
This btcusd indicator uses 3 different n-number of candlesticks and calculates the combined weighted sums of bitcoin price action from these candlesticks and plots these values a scale ranging from 0 to 100. Values of above 70 are considered to be overbought levels while values of below 30 are considered to be over-sold levels.
The time periods used to calculate the ultimate oscillator trading are 7 periods (short term trend), 14 periods (intermediate term trend) and 28 periods (long term trend).
Bitcoin Crypto Currency Analysis & Generating Trading Signals
This Bitcoin technical indicator can be used in generating buy & sell trading signals using different methods.
Center line Bitcoin Cross-over Trade Signal
Buy Bitcoin Signal - values above 50 center line level
Sell Bitcoin Signal - values below 50 centerline level
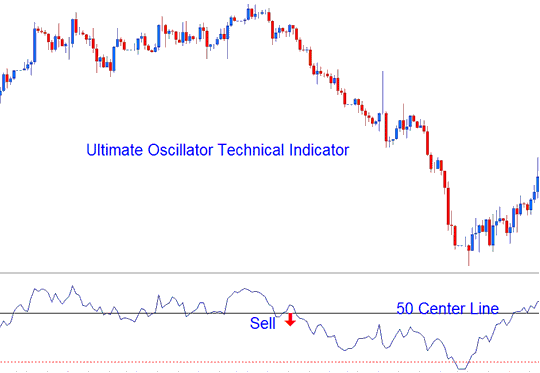
Center line Bitcoin Cross-over Trading Signal
Overbought/Over-sold Levels on Technical Indicator
Overbought - levels above 70 - sell bitcoin trading signal
Oversold - levels below 30 - buy bitcoin trading signal
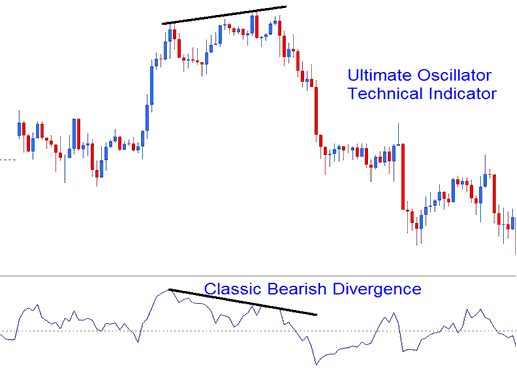
Divergence BTCUSD Trading
The oscillator trading can also be used to trade divergence signals, below is an example of a classic bearish divergence signal.
Technical Analysis
More Lessons & Tutorials:
- How to Trade Bitcoin Head & Shoulders Pattern
- RSI Hidden Divergence BTCUSD Trading Strategies
- How to Load a Profile of MT4 BTCUSD Charts in MT4 Platform
- Fibonacci Pullback Levels on BTCUSD Charts Tutorial Course
- What Happens in BTCUSD after an Up Bitcoin Trendline is Broken?
- Parabolic SAR Combination of Bitcoin Technical Indicators
- How to Read Falling Wedge Chart Pattern Explanation
- How to Trade Resistance & Support Levels in Day Trade
- How Can You Use Fibonacci Pullback Levels Trading Indicator in MT5 Software?
- BTCUSD Trendline Technical Indicator MetaTrader 4 Bitcoin Software


