Multiple Time-Frame Analysis
Multiple timeframes analysis equals using 2 time-frames to trade Bitcoin - a shorter one used for trading & a longer one to check Bitcoin trend.
Since it's always good to follow the market trend, in Multiple Time-frame Analysis, longer chart timeframe gives us the direction of the long term trend.
If the long term market direction supports the direction of the smaller chart timeframe then the probability of being profitable is greatly increased. This is because even if you make a mistake the long term bitcoin crypto currency trend will eventually save you. Also if you trade with the direction of btcusd market, then mostly you will be on winning side, this is what this type of trading analysis is all about.
Remember there a popular saying by many Bitcoin & stock market traders that says: 'The bitcoin trend is your best friend' - never go contra the btcusd market.
There are 4 different types of Bitcoin traders - all these use different charts to trade as shown below.
Examples of how each type of BTCUSD trader uses multiple Bitcoin BTCUSD time frames analysis strategies:
Scalpers
This group holds on to their trades for only a couple of minutes. Scalper never holds onto a trade for more than ten minutes. With the main objective of earning a small number of pips as profit, 5 - 20 pips.
A Scalper using 1 minutes trading chart time frame wants to go long, checks 5 minutes trading chart, that look like the one below, since 5 min illustrate btcusd crypto trend is heading up, then decides from the analysis it's ok to buy.
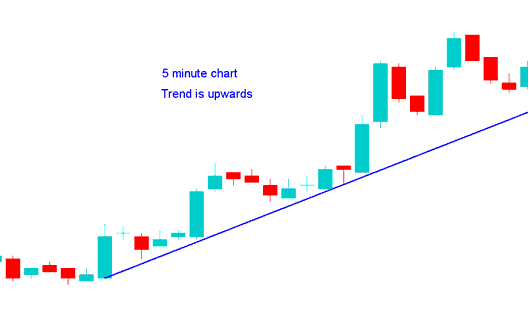
Best Chart Timeframe to Trade Bitcoin Crypto Currency
Day Traders
This group holds on to their trades for a few hours but not more than one day. With the objective of earning quite a number of pips: 30 - 100 pips.
Day trader trading 15 minute trading chart time frame wants to go long, checks the 1H chart, that look like the one below, since 1 hour highlights market bitcoin trend is heading up, then decides from the analysis it's ok to buy
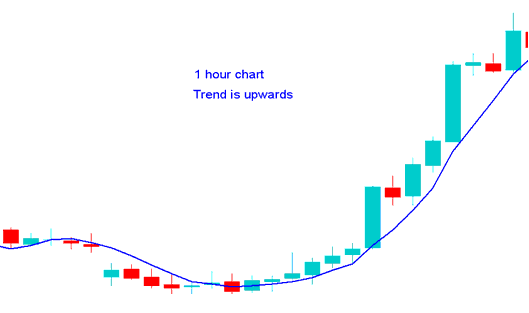
Best Chart Timeframe to Trade BTCUSD Crypto
Swing Traders
This group holds on to their trades for a couple of days to a week. With main objective of earning a big number of pips: 100 - 400 pips.
Swing trader using the 1 H chart time frame wants to open short, checks the 4 H chart, that look like the example illustrated below, since 4 hour highlights the btcusd crypto trend is heading down, then decides from the analysis it's ok to sell.
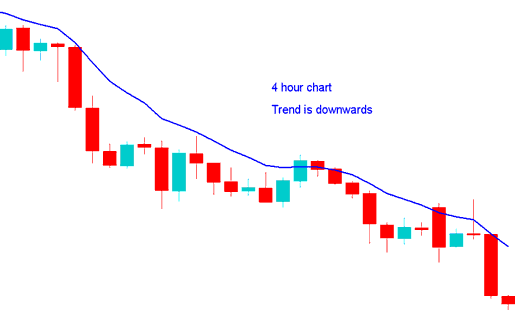
Best Chart Timeframe to Trade BTCUSD Crypto
Position BTCUSD Traders
These are the traders that hold onto their trades transactions for a period of weeks or months. With the objective of earning a big number of pips: 300 - 1000 pips.
A Position trader using daily chart time frame wants to short, checks week chart, week resembles the one below, since weekly illustrates the bitcoin crypto currency trend is heading down, then decides from the analysis it's ok to sell.
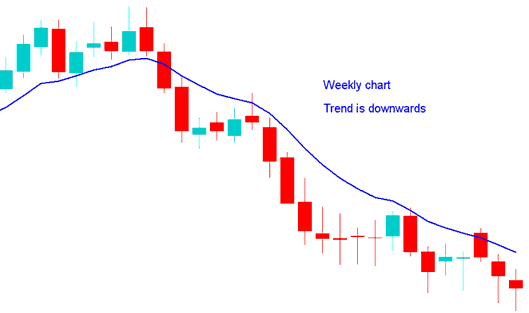
Best Chart Timeframe to Trade Bitcoin Crypto Currency
How to Define A Bitcoin Crypto Trend
Using a bitcoin system has three indicators - MA Cross-over System, RSI and MACD & uses simple rules to define the trend. Rules are:
Upward trend
Both MAs Moving Up
RSI Indicator above 50 Mark
MACD Above Center-Line
Downwards BTCUSD Crypto Currency Trend
Both MAs Moving Down
RSI Indicator below 50 Mark
MACD Below Centerline
For More details about this system read: How to Generate Bitcoin Signals with a Bitcoin Strategy.
Learn More Courses and Lessons:
- How Do I Login to a MT4 Bitcoin Account?
- How Do I Activate a Bitcoin Trade Expert Advisor EA in MetaTrader 4 Platform?
- How to Trade with BTCUSD System Signals Described
- BTC USD Trade Real Account Open DD
- How Do I Draw BTC USD Trend Lines Break Analysis?
- How to Add Bitcoin Chart in MetaTrader 4 Trading Platform


