Bitcoin Draw Fibo Projection Levels on Downward Bitcoin Trend
How Do I Trade Bitcoin and Draw Fibonacci Projection Levels on Downward Bitcoin Trend?
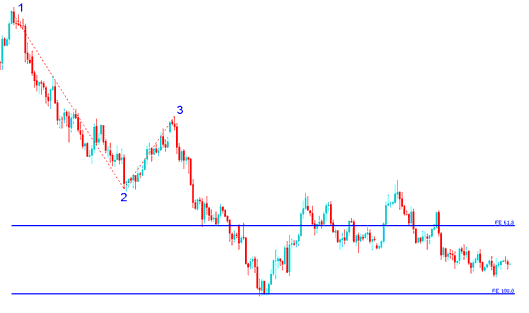
We draw the Fibo Projection trading bitcoin indicator tool from bitcoin chart point 1 to bitcoin chart point 2 to bitcoin chart point 3 as shown on the Fibo projection trading bitcoin example illustrated below. Remember we always draw this Fibonacci Projection tool in direction of the cryptocurrency trend. In the Fibo Projection example illustrated below, can you figure out what is the direction which we have drawn it? That's right - downward direction.
As a trader you'd also have used Fibo Projection level 100.0 %, just where the bitcoin price reached as illustrated on the Fibo Projection example illustrated below. That would have been a nice bitcoin crypto currency take profit order area.
Crypto Draw Fibo Projection Levels on Downward Trend?
From Fibo Projection trading bitcoin indicator tool example above, after drawing this Fibonacci Projection trading bitcoin indicator tool there are two levels that are used to show the bitcoin profit taking levels - these two Fibonacci Projection areas are represented as horizontal lines across the trading bitcoin chart marked as 61.8% BTCUSD Fibo Projection Level & 100% Fibo Projection Level.
Interpretation of Trading Draw Fibonacci Projection Levels on Trading Charts
BTCUSD Crypto traders Fib Projection levels to estimate where the bitcoin crypto currency price movement will reach to. There are two commonly used Fibo Projection areas: 61.8% Fibo Projection Level and 100% Fib Projection Levels - these fibonacci projection levels are used for setting bitcoin taking profit areas.
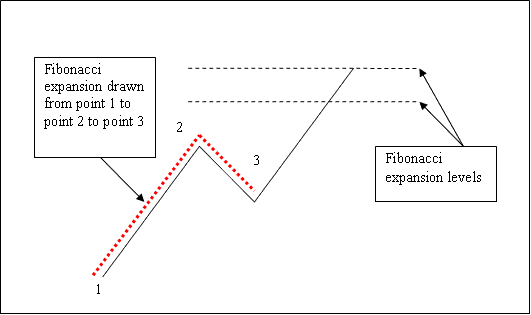
To draw Fib Projection areas on the trading bitcoin chart we wait until the bitcoin price retracement is complete & the bitcoin price starts to move in the original direction of the Bitcoin trend. Where the bitcoin crypto currency price retracement reaches is used as bitcoin crypto currency chart point 3. Fibo Projection Trading Bitcoin Indicator tool is drawn using three bitcoin chart points as shown on the Fibo projection trading bitcoin example illustrated below of how to draw the Fibo Projection Trading IndicatorTool.
The Fibo Projection example illustrated below shows the three Chart Points where the Fibo Projection trading bitcoin technical indicator is drawn, labeled as Crypto Chart point 1, Cryptocurrency point 2 and Cryptocurrency point 3.
Cryptocurrency Point 1 is where the bitcoin crypto currency trend started, Crypto Point 2 is where the bitcoin price pulled back & retraced & Cryptocurrency Point 3 is where the bitcoin retracement reached as highlighted on the Fibo Projection Technical Indicator Tool example illustrated below.
How Do I Trade Crypto and Draw Fibonacci Projection Levels on Downward Trend?
Please take note where these Fibo Projection levels are drawn - Fibo Projection levels are drawn above the Fibonacci trading bitcoin indicator, these are the btcusd chart points where a trader will set the bitcoin take-profits using these fibonacci Projection Levels - 61.8% Fibo Projection Level & 100.0% Fibo Projection Level.
Draw Fibonacci Projection Levels on Downward Bitcoin Trend?
Get More Topics & Tutorials:
- How to Analyze MetaTrader 4 BTCUSD Trend Lines Trading Indicator & MT4 Bitcoin Channels Trading Indicator on MetaTrader 4 Platform
- RSI 50 Center Line Crossover Bitcoin Trade Strategies
- How Trade BTC USD with BTCUSD Trend Reversal Strategy
- How Do I Learn How to Trade Using MetaTrader 5 Trading Platform?
- How Do I Draw Fibo Extension in MetaTrader 4 BTCUSD Charts?
- How to Open MetaTrader 5 Practice BTC USD Trade Account
- How Do I Add MT5 Trading BTC USD Expert Advisor EA Bots on the MetaTrader 5 Platform?
- How Do I Add a Bitcoin Trade Expert Advisor EA to MetaTrader 4 Platform?
- MetaTrader 4 BTCUSD Platform Software Multiple Timeframes in Chart
- MetaTrader 4 Live Chart BTC USD Live Charts


