Inverted Hammer & Shooting Star Candlesticks
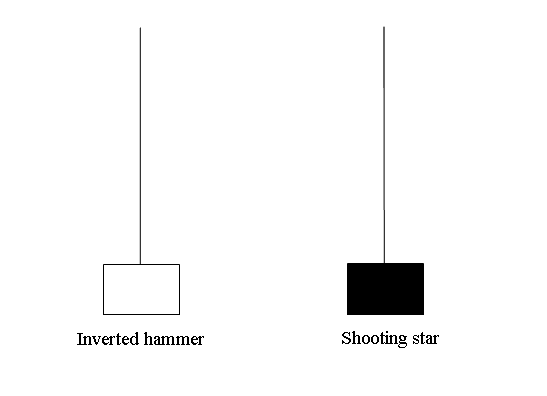
Inverted hammer candlesticks and shooting star candle-sticks look alike. These candlesticks have a long upper shadow & a short body at the bottom. Their fill colour doesn't matter. What matters is the point where these candle-sticks appear whether at the top of an upward market trend (shooting star) or the bottom of a downward market trend (inverted hammer).
The difference between the two is that inverted hammer candlestick is a bullish reversal pattern while shooting star candle is a bearish reversal pattern.
Upwards Trend Reversal - Shooting Star CandlesDownwards Trend Reversal - Inverted Hammer Candles
Inverted Hammer and Shooting Star Japanese Candlesticks
Inverted Hammer Japanese Candle
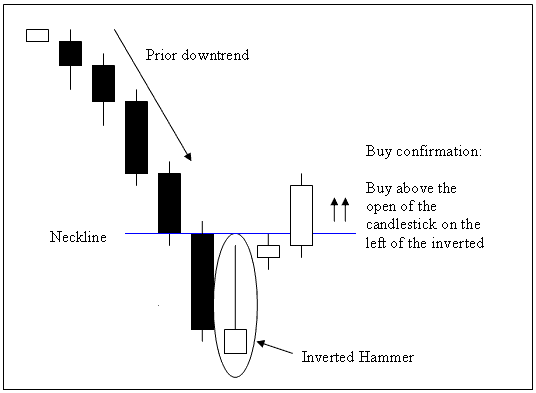
The Inverted Hammer candlestick is a bullish reversal candle pattern. It occurs at the bottoms of a BTCUSD Crypto Currency downward trend.Inverted hammer candlestick occurs at the bottom of a down-trend and indicates possibility of reversal of the downward Bitcoin price trend.
Inverted Hammer Candlestick Pattern - Bitcoin Trading
Analysis of Inverted Hammer Bitcoin Trading Candle
A buy signal generated using the inverted hammer candle setup is confirmed when another candlestick is formed & this new candlestick closes above the neck line, this is the opening of candlestick on the left side of this hammer candlestick as illustrated above. The neck-line in this case is a resistance level.
If the candle formed next to the hammer candlestick doesn't close above the neck line, then as a trader you wait to see if the subsequent candlestick closes above the neck line. Only when a candlestick that closes above the neck line is formed is when this bullish reversal pattern is confirmed.
Stop losses for the buy trade that has been opened should be set a couple of pips below the lowest price on the recent low.
An inverted hammer candlestick is named so because it signals that the market price is hammering out a bottom.
Shooting Star Japanese Candlestick
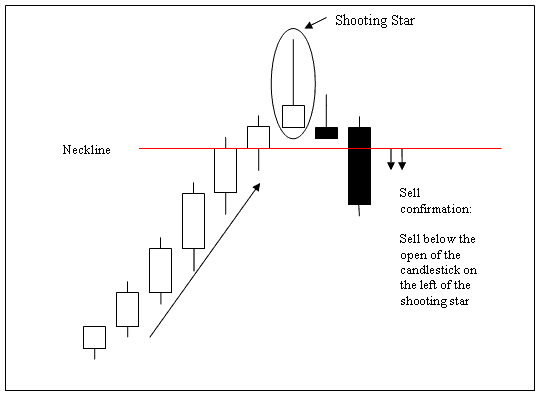
The Shooting Star candlestick is a bearish reversal candle pattern. It occurs at the top of an upward trending market.Shooting Star candlestick occurs at the top of an up-trend where the open price of Bitcoin is the same as the low price or close to the low price - meaning price opened at that point rallied up but was pushed back down to close near the same opening price.
Shooting Star Candle Pattern - Bitcoin Trading
Technical Analysis of Shooting Star Candle
A sell signal generated using the shooting star candlestick pattern is confirmed when a new candlestick closes below the neckline: this neckline is the opening of the candlestick on the left side of the shooting star candlestick as shown on the example above. The neck line in this instance is a support level. Stop loss orders for the sell trades opened using this setup should be set a few pips above the highest price in the recent high.
The Shooting Star candlestick is named so because it is formed at the top of an upward BTCUSD Crypto Currency market trend - this candlestick pattern resembles a shooting star up in the sky thus it name - shooting star.
Learn More Topics and Tutorials:
- How Can You Analyze a New BTCUSD Order in MT4 iPad App?
- How Can You Login to MT4 BTCUSD Account Described?
- Drawing Fibonacci Extension Bitcoin Trading Levels in Upwards BTC USD Chart Trend & Downwards BTC USD Chart Trend
- Exit Trade Signals & Setting Stop Loss Levels
- How Can You Determine if there is a Market Trend?


