Cryptocurrency Chart Time Frames
MT4 Chart Time Frames; Multiple Time Frame Indicator
Periodicity is commonly known as Cryptocurrency Chart Time Frames by many cryptocurrency traders. On the MetaTrader 4 platform.
The button below is used to choose the periodicity or bitcoin chart time frame to trade with. This button can be accessed on the MetaTrader 4 software as shown below.
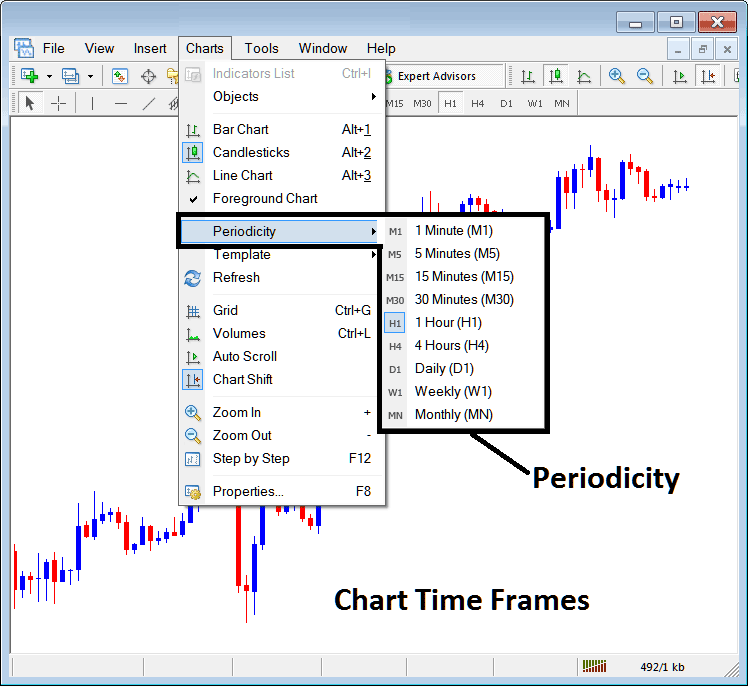
MT4 Chart Timeframes
On the MT4 platform these bitcoin chart timeframes are:
- 1 Min Cryptocurrency Chart Timeframe - M1
- 5 Min Cryptocurrency Chart Timeframe - M5
- 15 Minute Cryptocurrency Chart Time Frame - M15
- 30 Minutes Cryptocurrency Chart Time Frame - M30
- 1 H Time-frame - H1
- 4 Hours Cryptocurrency Chart Time Frame - H4
- Daily Cryptocurrency Chart Time Frame - D1
- Weekly Cryptocurrency Chart Timeframe - W1
- Monthly Cryptocurrency Chart Timeframe - MN
How to Know Which Chart Time-frame You are Using
A common question especially if you are new to bitcoin trading would be how to identify which bitcoin chart time frame you are using on your MetaTrader 4 platform:
There are various methods of knowing which MT4 bitcoin chart time frame you are using as Shown below:
Use the above Menu as Shown above
In the above crypto example once you select the periodicity button under the trading charts menu, then the listing of MT4 bitcoin chart time frames is shown and the btcusd chart timeframe that is currently chosen, the one that you're using will be high lighted with a different colour, on our above example this is the 1 Hour(H1) bitcoin chart time frame, whose Icon on the left is high-lighted in light blue.
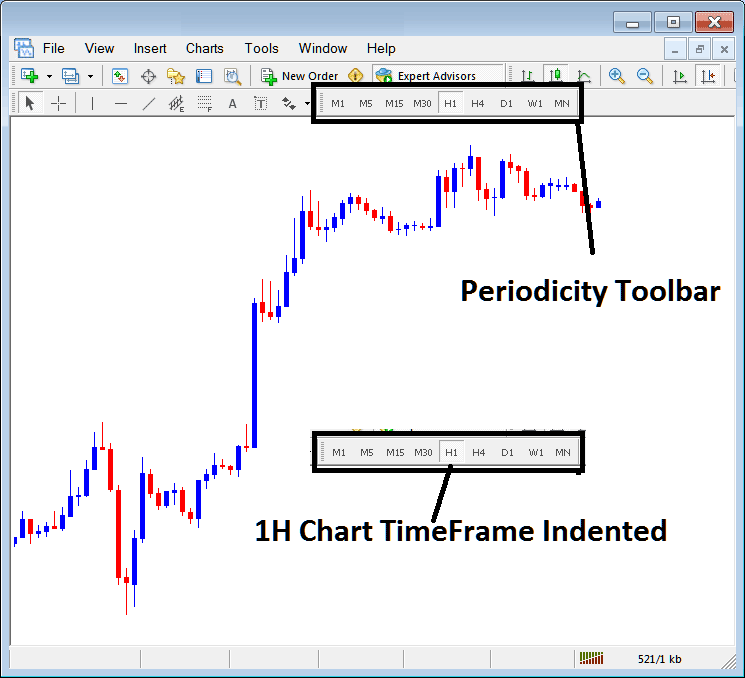
MT4 Multiple Chart Time-frames On One Chart - Multiple Time-frame In One Chart
This Meta Trader 4 periodicity tool-bar is by default located at the top of the MetaTrader 4 platform and has all the btcusd chart timeframes marked as illustrated below. The chart time frame that a trader is using will be marked differently from the other bitcoin chart time frames, the selected bitcoin chart timeframe will be "indented" as shown below:
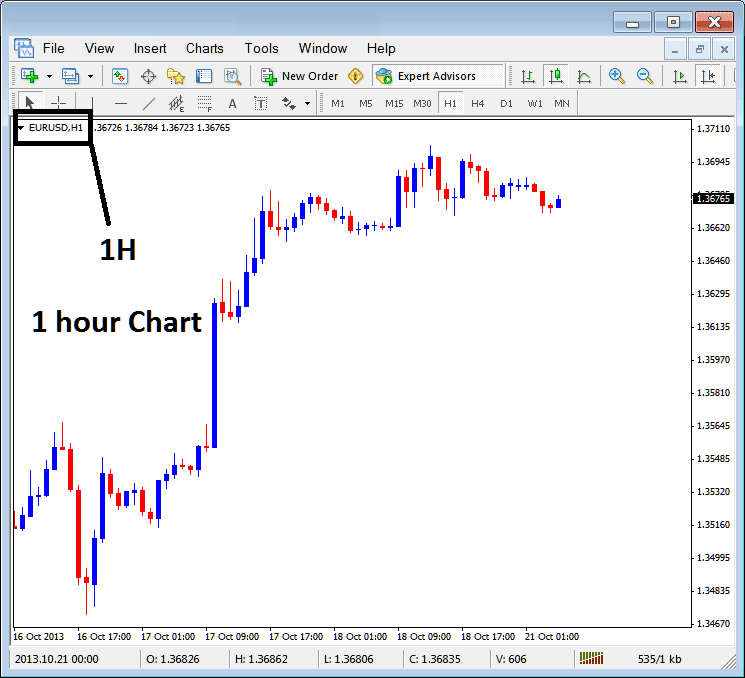
Use the information displayed at the top left corner to get MT4 Chart Time Frame
At top-left corner of bitcoin trading MT4 chart, MetaTrader 4 bitcoin chart time-frame is displayed as illustrated below:
1 Hour MetaTrader 4 Chart Time-Frame
15 Minutes MT4 Time-Frame
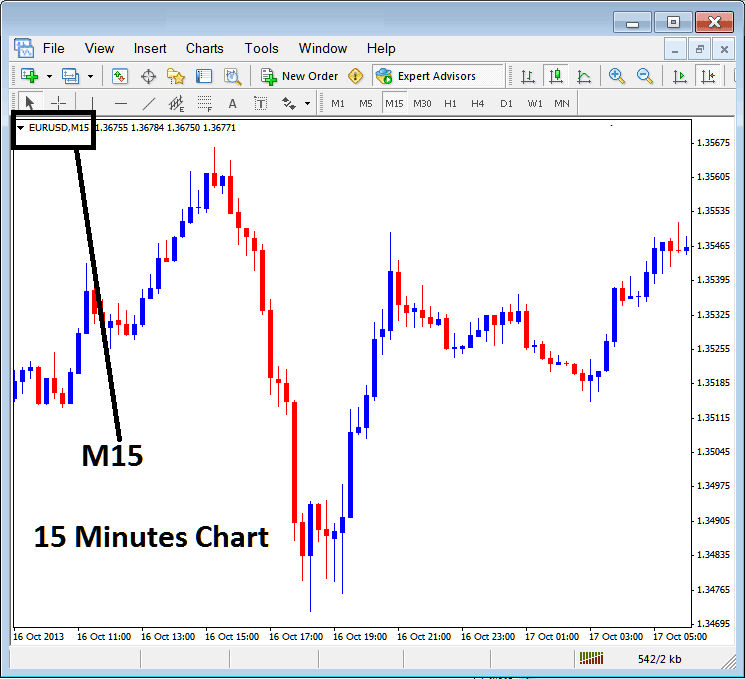
When you open a chart you can then use the above 3 methods to know which periodicity - bitcoin chart time frame you are trading with.
You also can use the tabs, if you're trading many bitcoin charts. To view this tab, Go to "View Menu" then Choose "Charts Bar". The following MetaTrader 4 bar will then appear that you can use to navigate and it shows the cryptocurrency as well as the bitcoin chart time frame.
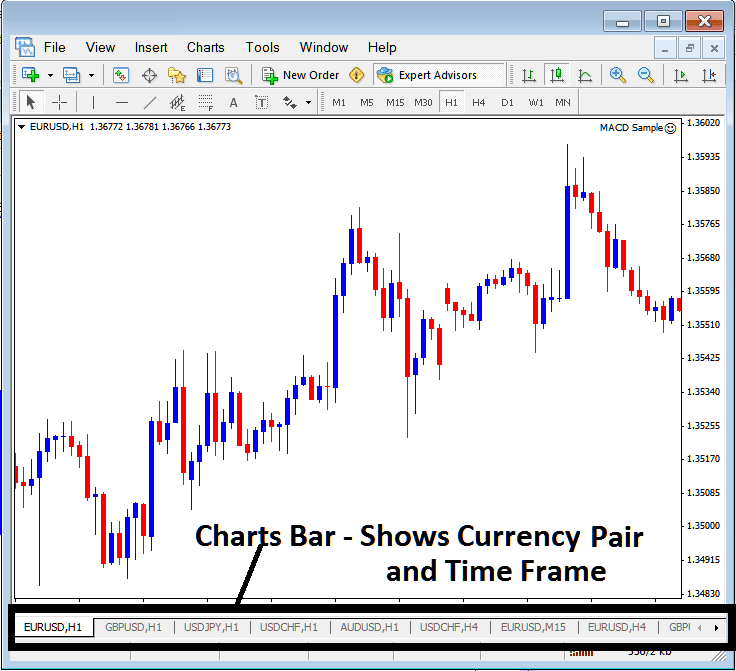
Navigation tabs in MetaTrader 4 work space.
Study More Courses:
- How to Add a MT4 Bitcoin Automated Expert Advisor in MetaTrader 4 Trading Platform for Trading
- Bollinger Percent B or %b Bollinger Percent B BTC/USD Trading Indicator
- How Do I Create a MT4 BTCUSD Expert Advisor EA in MetaTrader 4 Platform?
- BTC USD Trend Line Trading Indicator Free Download
- How to Setup MetaTrader 5 Bitcoin Trade Platform Software Tutorial Guide Guide
- How to Load Bitcoin MetaTrader 4 Trading Chart Template in MetaTrader 4 Platform
- How to Use Bears Power Technical Indicator Explained
- How Do I Trade BTC USD & Add a MT5 Bitcoin Expert Advisor EA in MetaTrader 5 Platform?
- What Happens in BTC USD after a Bear Flag Pattern?
- List of BTC USD Trade Setups used to Trade the BTC USD Market


