Multiple Time Frame Analysis in Bitcoin Trading
Multiple time frames analysis equals using 2 chart timeframes to trade BTC/USD Crypto - a shorter chart time-frame used for trading and a longer chart time-frame to check the Bitcoin price trend.
Since it's always good to follow the market trend, in Multiple Time-frame Analysis, the longer chart time-frame gives us the direction of the long term Bitcoin price trend.
If the long-term market trend direction supports the direction of the smaller chart time frame then the probability of being profitable is greatly increased when using this setup. This is because even if you make a mistake in opening your Bitcoin trade the long-term trend will eventually save you. Also if you trade with the direction of market trend, then mostly your trades will be on the winning side, this is what this multiple timeframe analysis is all about.
Remember there a popular saying by many traders and investors that says; "The trend is your best friend' - never go contra the market trend. It means that trading along the direction of the trend is what will consistently help you as a trader to continue making profit when trading the online Bitcoin Crypto Currency market. There are four different types of Bitcoin traders - all these traders use different chart timeframes to trade as shown below.
Examples of how each type of Bitcoin trader uses multiple timeframes analysis trade strategy:
Scalpers
This group of traders holds onto their trades only for a couple of minutes. Scalper never holds onto a trade for more than ten minutes. With the objective of making a small amount of profits between $30 and $50 per trade.
A Scalper using 1 minute trading chart time-frame wants to open long, checks 5 minute BTCUSD chart, that looks like the one below, since 5 minute show trend is heading up, then the trader decides from this trading analysis that it's okay to buy BTCUSD.
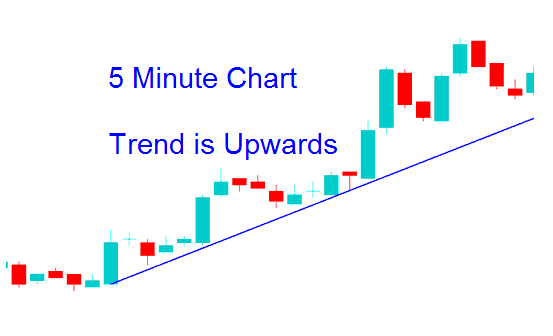
Scalper Bitcoin Chart Time frame - 5 Minute BTCUSD Chart
Day Traders
This group of Bitcoin traders holds on to their trades for a couple of hours but not more than a day. With the objective of making quite a number of dollars in profit, between $50 and $200 per trade.
Day trader trading 15 minutes BTC/USD Crypto chart timeframe wants to go long, checks 1 hour chart, that looks like the one below, since 1 hour displays price trend is heading up, then decides from this analysis it is okay to buy Bitcoins.
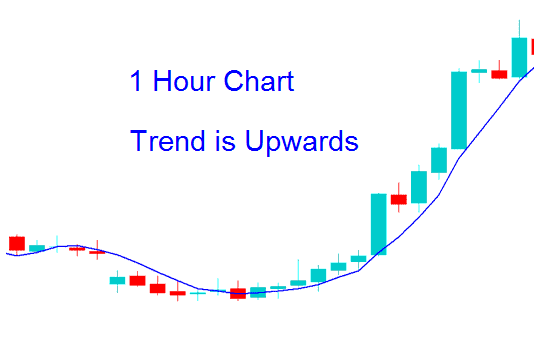
Day Trader Bitcoin Chart Time frame - 1 Hour BTCUSD Chart
Swing Traders
This group of Bitcoin traders holds on to their trades for a couple of days to a week. With the objective of making a large number of points in profit, between $200 and $1,000 in profit.
Swing trader using 1 H Bitcoin Crypto Currency chart wants to go long, checks the 4 hour chart, that looks like the example below, since 4 hour chart shows the trend is heading up, then decides from this analysis it is okay to buy Bitcoin.
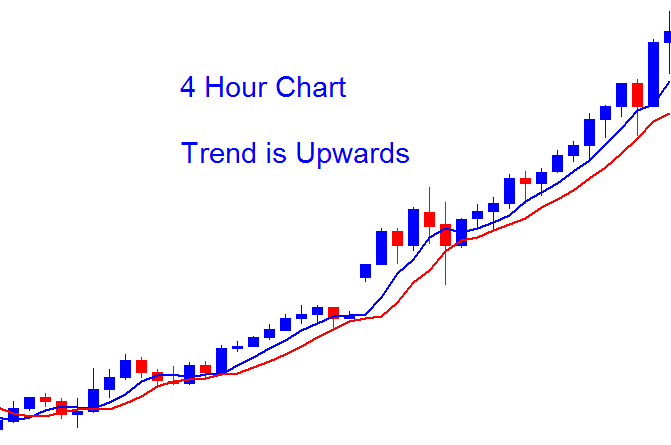
Swing Trader Bitcoin Chart Time frame - 4 Hour BTCUSD Chart
Position Bitcoin Crypto Currency traders
These are the investors that hold on to their Bitcoin trade transactions for weeks or months. With the objective of making a large number of points in profit of between $1,000 and $2000 per trade.
Position trader using the daily Bitcoin Crypto Currency chart time frame wants to go long, checks the weekly chart, week resembles the one below, since weekly displays the trend is heading up, then position trader decides from this analysis it is okay to buy BTCUSD.
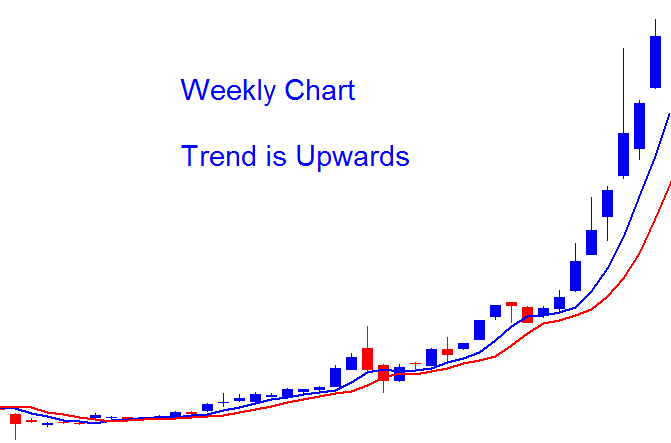
Position Trader Bitcoin Chart Time frame - Weekly BTCUSD Chart
How to Define A BTCUSD Trend
As a beginner trader wanting to start trading Bitcoins you may want to learn how to define a trend. You can define the trend using a Bitcoin system that has Three indicators - MA Crossover System, RSI & MACD and using simple trading guide-lines to define the market trend. The rules are:
Upwards trend
- Both Moving Averages are Moving Upwards
- RSI above 50
- MACD above Center Line
Down-ward BTCUSD Crypto Trend
- Both Moving Averages are Moving Downwards
- RSI below 50
- MACD below Centerline
For more explanation about how to define price trend & using Bitcoin systems read the article on how to generate signals using a Bitcoin system, explained on this web site.
Learn More Courses & Lessons:
- How to Open MetaTrader 4 BTCUSD Demo Practice Account
- Learn Where to Learn Techniques of Trade BTC USD Crypto
- How to Analyze BTC USD Charts Using MetaTrader 4 Bitcoin Trade Platform Software Software
- Understanding Candlesticks in BTC USD Trade
- How Do I Draw BTC USD Trend Lines in MetaTrader 5 Bitcoin Charts?
- How to Analyze BTC USD MetaTrader 5 Upwards BTCUSD Channel in MetaTrader 5 Platform
- How to Learn a BTCUSD Trade Tutorial Course
- How Can I Open BTC USD Trade Account with $5?
- MetaTrader 4 Bitcoin Trade Profit Target Trading Indicator
- BTC USD Trade Psychology Tutorial Guide for Beginners


