Relative Strength Index Bitcoin Analysis & RSI Bitcoin Trade Signals
Developed by J. Welles Wilder, explained in the book "New Concepts in Technical Systems".
RSI is the most popular indicator & it is a momentum oscillator and a bitcoin trend following indicator. RSI compares a bitcoin price magnitude of the recent bitcoin price gains against its magnitude of the recent losses bitcoin price losses and draws this data on a scale of values which ranges between 0-100.
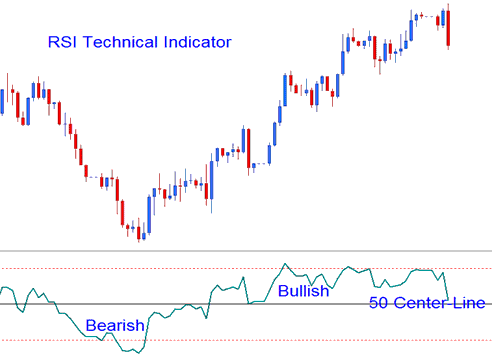
RSI measures the momentum of bitcoin crypto; values above 50 signify bullish momentum while values below 50 center-line signify bearish momentum.
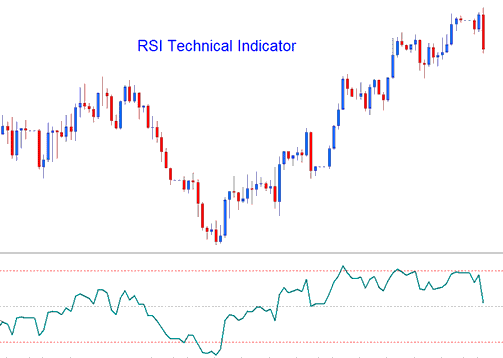
- RSI is drawn as a green line
- Horizontal dashed lines are plotted to identifying over bought & oversold levels are i.e. 70/30 levels respectively.
Bitcoin Analysis & Generating Trading Signals
There are several different techniques used to trade, these are:
50-level Cross over Signals
- Buy trade signal - when the indicator crosses above the 50 a buy/bullish trading signal is given.
- Sell Bitcoin Signal - when the indicator crosses below 50 a sell/bearish signal is given.
RSI Bitcoin Patterns
Traders can draw bitcoin trend lines & map out chart patterns on the RSI indicator. The RSI commonly forms cryptocurrency patterns such as head & shoulders cryptocurrency pattern which might not have formed clearly on the bitcoin price chart.
Bitcoin Support/Resistance Break outs
RSI is a leading indicator & can be used to predict Support/Resistance Breakouts before bitcoin price breaks its support/resistance level. RSI uses the swing failure signal to predict when bitcoin price is about to break resistance and support zones.
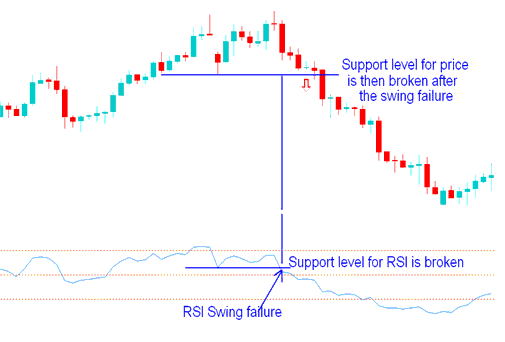
Swing Failure - Support and Resistance Breakout
Overbought/Over-sold Conditions on Technical Indicator
- Overbought levels above 80
- Oversold- levels below 20
These levels can be used to generate bitcoin signals such as when RSI turns up from below 20 after over-sold, buy and sell when RSI crosses to below 80 after overbought, sell. These signals are not suitable for Bitcoin because they are prone to a lot of whipsaws.
Divergence Bitcoin Trade Setups
Divergence trading is one of the trading analysis method used to trade reversals of the bitcoin price trends. There are 4 types of divergences that can be traded with this trading indicator covered in the divergence guide on this web site.
Learn More Lessons & Topics:
- How to Trade MetaTrader 4 Bitcoin Trading Chart Tutorial Course
- EA BTC/USD VPS Hosting
- MACD Line Crossover Signal Trade System
- How Can You Analyze MetaTrader 5 Chart Signals Beginners Tutorial Course?
- How to Trade Consolidation Chart Patterns
- Hanging Man Bearish BTC USD Candle Patterns
- How Can You Learn How to Use MT5 BTC USD Trading Software
- Multiple Timeframe Analysis in Bitcoin Trading
- How to Read BTC USD Trading Candles Patterns BTC USD Strategies
- What Happens in Bitcoin after Bear Flag Chart Pattern?


