Average True Range Bitcoin Analysis & ATR Bitcoin Trade Signals
Created by J. Welles Wilder
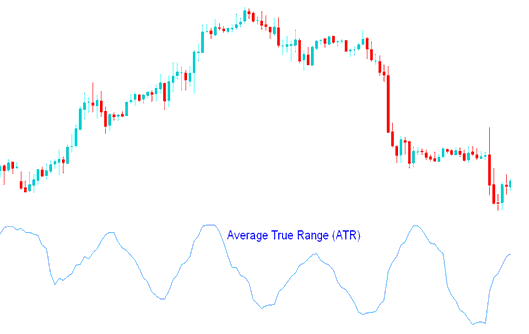
This btcusd indicator is a measure of volatility - it measures the range of bitcoin price movement for a particular bitcoin price period. The ATR is a directionless indicator & it doesn't determine the direction of the Bitcoin trend.
High ATR indicator values
High Average True Range indicator values indicated market bottom after a selloff.
Low ATR values
Low Average True Range values showed extended periods of sideways bitcoin price movement- Bitcoin Price Range, such as those found at market tops and consolidation periods. Low ATR values are typical for the periods of sideways movement of long duration which happen at the top of the btcusd market and during consolidation.
Calculation
This btcusd technical indicator is calculated using the following:
- Difference between the current high & the current low
- Difference between the prior closing bitcoin price and the current high
- Difference between the prior closing bitcoin price & the current low
The final Average is calculated by adding these values and calculating the average.
BTCUSD Crypto Currency Analysis & How to Generate Trading Signals
Average True Range indicator can be analyzed using the same principles as other volatility trading indicators.
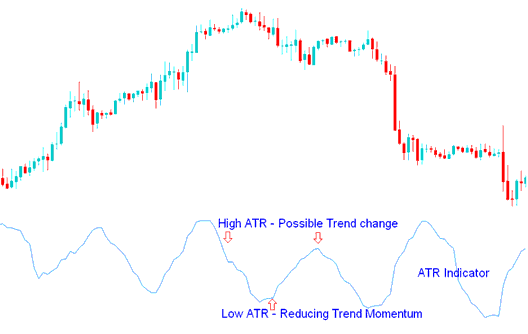
Possible bitcoin trend change signal - The higher the value of technical indicator, the higher the probability of a bitcoin trend change;
Measure of bitcoin trend momentum - The lower the indicator's value, the weaker the bitcoin trend movement.
Analysis in Bitcoin Trading
Study More Tutorials and Topics:
- Chandes Dynamic Momentum Index Bitcoin Technical Indicator Analysis
- Bitcoin Trading Money Management in Intraday BTC USD Tutorial
- How Can You Open MT4 Chart BTC USD Trading Tick Chart?
- MT4 Bitcoin Chart Change Chart Time BTCUSD Charts
- How to Trade & Draw a Trend-line on a Chart
- How Can You Analyze Trade Fibonacci Extension Levels in Trading Charts?
- How Can You Save a BTC/USD Trading Template on MT4 Platform?
- How Can You Analyze Fibo Extension Levels BTC USD Strategy?
- Bitcoin Trading MT5 Line Chart Described
- How Can You Draw Bitcoin Trendlines in MT4 Trading Software for Trade?


