Chande Dynamic Momentum Index Bitcoin Analysis & Chande DMI Trading Signals
Developed by Tushar Chandes
Chande DMI indicator is similar to Welles Wilder’s Relative Strength Index indicator, however, there's one very important difference.
RSI uses a fixed number of bitcoin price periods while the Chandes Momentum Dynamic Index uses a variable amount of bitcoin price periods as market volatility changes.
The number of bitcoin price periods used by this Momentum Index indicator decreases as market volatility increases. This allows the technical indicator to be more responsive to bitcoin price changes.
The Chande DMI is more accurate than the RSI, has less whipsaw fakeouts and is less Choppy
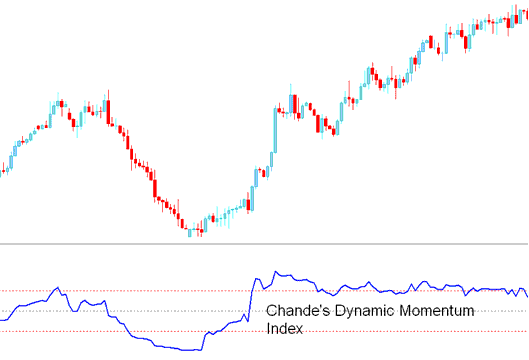
BTCUSD Analysis and Generating Signals
Buy Trade Signal
A buy signal gets generated when the DMI crosses above the 50 level mark.
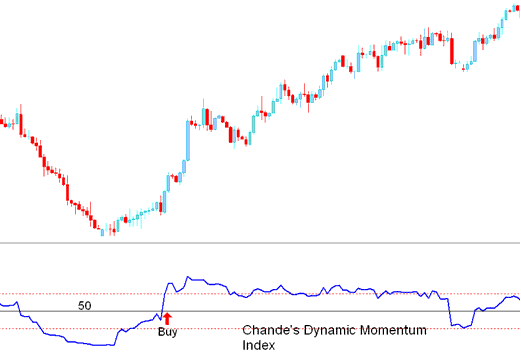
Buy Trading Signal
Sell Trading Signal
A sell signal gets generated when the DMI crosses below 50 level mark.
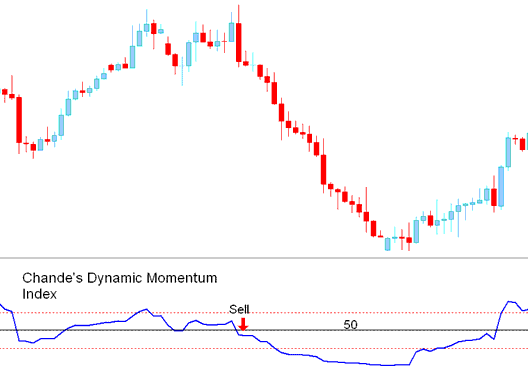
Sell Trading Signal
Learn More Topics & Lessons:
- Identifying Up Trends in Bitcoin Trading
- How Can You Trade Bitcoin Reversal Chart Patterns?
- How Can You Analyze a BTC/USD Downwards Trend Trading Analysis?
- List of BTCUSD Price Action Trading Strategies
- What is the Difference Between Bitcoin Standard Contract & BTC USD Nano Contract?
- How Can You Set a Sell Stop Order in MT5 Online Software?
- Best Trend BTC USD Technical Indicators
- MACD BTC/USD Technical Indicator Analysis MACD BTC/USD Technical Indicator
- Upwards BTC USD Trendline Crossover Reversal Strategy


