How to Draw Fibonacci Retracement Areas on MetaTrader 5
To calculate these price pull-backs on the Bitcoin price chart for example on the MetaTrader 5 platform we use Fibo retracement areas indicator tool as shown on the shot below.
If you want to examine some Bitcoin price charts using this Fibonacci retracement tool, it is already provided for in the MT5 platform, the following process is used to find this indicator on the MetaTrader 5 Software. On the MT5 this Fibonacci retracement indicator will then automatically draw the Fibo retracement areas on a Bitcoin price chart - once this indicator is placed on the Bitcoin Crypto Currency BTCUSD chart.
To add this tool on the MetaTrader 5 software, you can use the following short-cut method:
- Click Insert
- Click Objects
- Click Fibonacci
- Click Fib Retracement
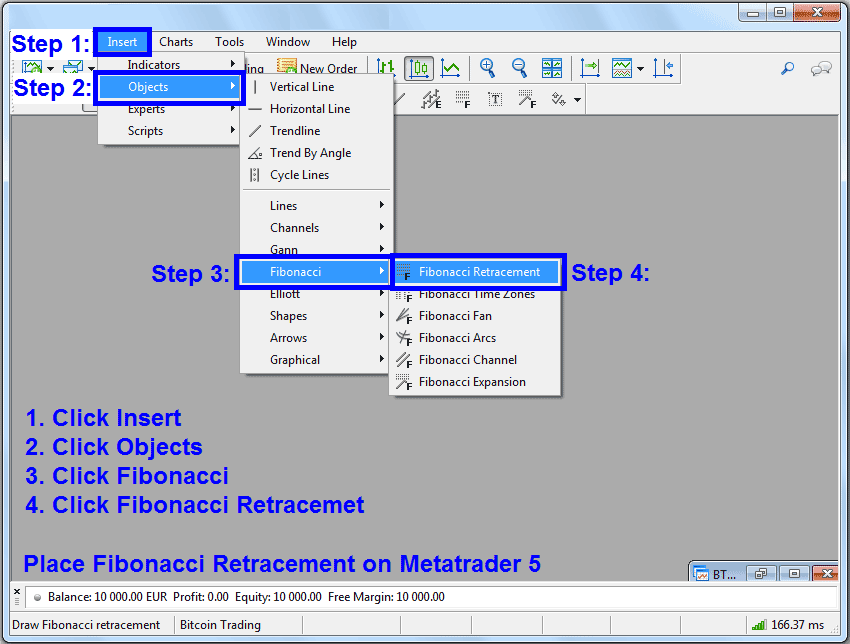
Place Fibo Retracement on MT5
After adding this Fibonacci retracement areas tool on the MetaTrader 5 platform - this indicator tool can then be accessed from "MetaTrader 5 Line Studies Tool Bar" as illustrated below.
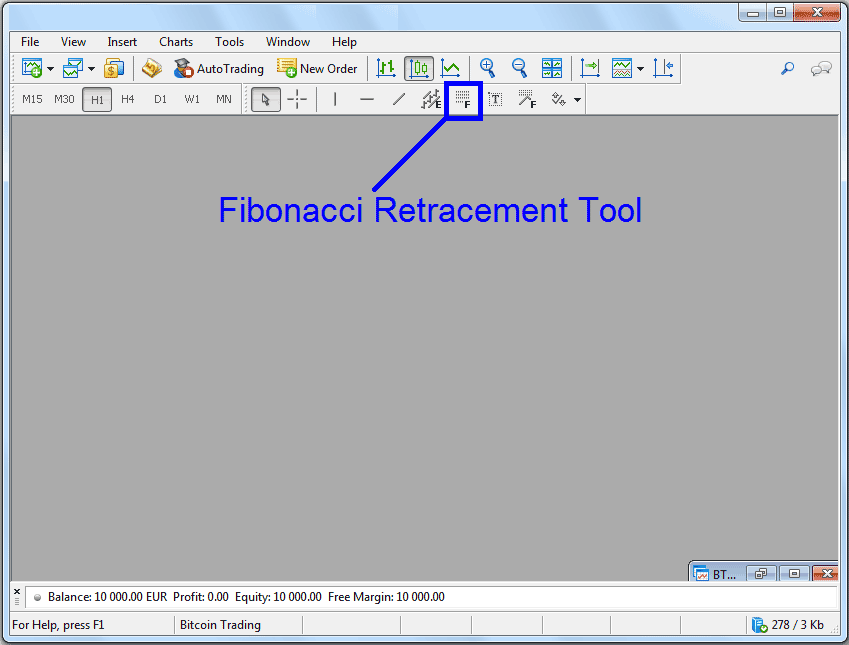
Fibo Retracement Tool - MT5 Bitcoin Software
This Fib retracement technical indicator is located on MT5 ("Line Studies Tool Bar"), to go to this tool-bar click "View" button key at top left corner of MetaTrader 5 next to "file", then choose and click "Tool Bars", Then Tick "Line Studies". You can study how to use Fibo retracement tool on the MetaTrader 5 platform using a demo demo practice account.
Shown Below is an illustration of the Fibonacci retracement technical indicator, we always plot this indicator between two points, point 1 and point 2, in direction of the Bitcoin price trend as shown below.
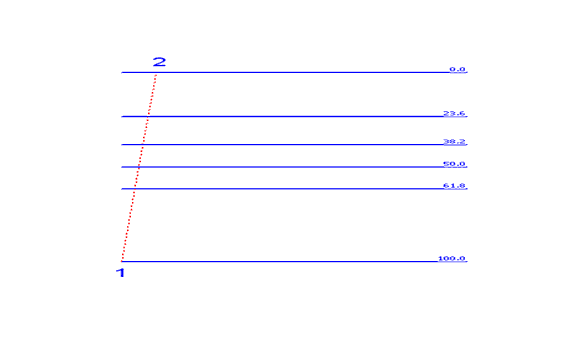
Bitcoin Fibonacci Retracement Zones
How Do I Draw Fibo Retracement Levels between Two Points
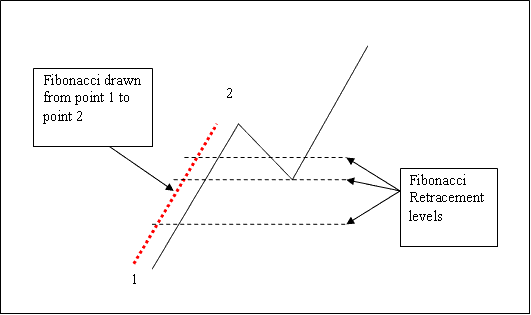
How to Place Fibo Retracement on a Bitcoin Price Chart
To Place this BTCUSD Crypto Currency Fibonacci Retracement Levels tool on a Bitcoin price chart, click on the button shown above on the MetaTrader 5 platform. Then select two chart points, the first chart point is where the trend starts and the second chart point is where the trend pull-back starts.
To adjust this indicator just double-click on it and "adjust points" will appear on the point 1 and 2 - shown as small squares, click & hold your mouse button to move these points to where you as the trader want them to be placed exactly. You can practice using this BTCUSD Crypto Currency Fibonacci Retracement Levels tool by using a practice Bitcoin Crypto Currency trading account.
More Tutorials and Courses:
- BTCUSD Trading Real Account Open DD
- What are the BTCUSD Trading Market Sessions Described?
- How Can You Analyze Fibo Pullback Levels BTC USD Trading Analysis?
- How to Trade a BTC/USD Trading Candle Pattern
- How to Learn BTC USD Training Tutorial Guide for Beginners Guide
- BTCUSD Add a Downloaded MetaTrader 4 Bitcoin Trading Expert Advisor in MT4 Platform
- Bitcoin Training Tutorial Guide Website Learn a BTC/USD Tutorial
- How to Open BTCUSD Trade
- Regulated BTC USD Broker Review
- MT4 a BTC/USD Trading Software Used to Trade BTCUSD


