Trading Bitcoin Using Pivots
Pivot Points is a set of indicators that were developed by floor traders trading the commodities markets so as to help them identify potential market turning points. These market turning points were known as pivots. These pivot points are calculated in order to determine the levels at which the market sentiment of the current market trend could change from bullish to bearish or vice versa.
Bitcoin Crypto Currency traders use these points as markers of support and resistance levels.
These pivot points are calculated as the average of the high, low and close from the previous trading session:
Pivot Point = (High + Low + Close) / 3
Day traders use the calculated pivot points to determine levels of entry, levels of setting stop losses and levels of setting take profit for their Bitcoin trades. Pivot points try to determine where the majority of the traders are setting their orders at the same time - when all of the Bitcoin traders are doing the same thing.
In analysis, a pivot point is a significant financial market indicator that is used by currency traders to predict the price movement. This btcusd indicator is calculated as an average of significant prices (high, low and close) from the performance of market prices in the previous period.
Bullish Sentiment - If prices in the following period trade above the center pivot Point: this is evaluated as a bullish sentimentBearish Sentiment - If prices in the following period trade below the central pivot Point: this is evaluated as a bearish sentiment
The central pivot point is also used to calculate additional levels of support & resistance, below and above this central pivot point, respectively - by either adding or subtracting price differentials calculated from previous trading data.
A Pivot & the associated support and resistance areas are often turning points for the direction of the market price movement.
In an upward trend - price stays above the pivot point, the resistance areas may represent a ceiling level for the market price and if prices go above these levels then the up trend is no longer sustainable and a retracement may occur.
In a downward trend - price stays below the pivot point, the support levels might represent a floor level for the market price & if prices go below these levels then the downtrend is no longer sustainable and a rally (pull back) may occur.
The Central Pivot Point is used to calculate the support and resistance areas as follows:
Pivot points consist of a central point level surrounded by 3 support levels below and 3 resistance areas above it. These pivot points were originally used by floor traders trading equities and futures exchange markets mainly because they provided a quick way for the traders to get a general idea of how the market was moving during the course of the day using a few calculations. Over time, these pivot points also proved to be exceptionally useful in other markets as well.
One reason why these pivot points are now so popular is because they are considered to be a 'leading' (or predictive) technical indicator rather than a lagging technical indicator.
All that's needed to calculate the pivot points for the upcoming (current) day is the previous day high, low, and closing prices. The 24-hour cycle pivot points in this technical indicator are calculated according to the following formulas:
The central pivot point can then be used to calculate the 3 support and 3 resistance levels as follows:
Resistance 3Resistance 2Resistance 1Pivot PointSupport 1Support 2Support 3
The Pivot Points indicator is illustrated below:
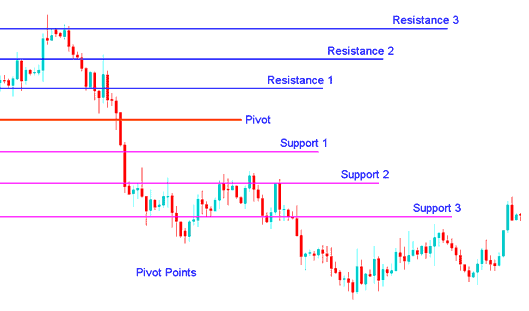
Bitcoin Using Pivot Points
Pivot Points Analysis
The central pivot point itself represents a level of the highest resistance or support depending on the overall market sentiment. If the market is range bound and directionless then price will often fluctuate greatly around this level until a price breakout develops.
Prices above or below the central pivot point indicates the overall sentiment as bullish and bearish respectively. Pivot Point indicator is a leading technical indicator that provides signals of potentially new highs or lows within a given chart time=frame.
The support and resistance areas are used as exit points - for example, if the price is trending upwards & prices are above the central pivot, then Bitcoin prices continue to move up to the first and then the second resistance level - then Bitcoin traders can use this second resistance level as a good place to close their buy trade, as the probability of resistance and reversal increases greatly with every resistance area.
In pivot point trading analysis there are 3 levels commonly recognized above & below the center pivot point. These levels are calculated from the range of the price movement in the previous trading Bitcoin price period and then added to the central pivot for resistance areas and subtracted from the central pivot for support levels.
Pivot Points trading analysis is used in three ways:
BTCUSD Trading Trend Direction: Central pivot point is useful when determining the general trend of Bitcoin prices. Trades are only opened in direction of the market trend. Buy trades are opened when price of Bitcoin is above the center pivot point and sell trades are opened when the price of Bitcoin is below the central pivot point.
Price Breakout: In a price breakout a bullish signal is when prices break upwards through the central pivot point or one of the resistance levels (typically Resistance Level 1). A sell signal is when price breaks-out down ward through the central pivot point or one of the support levels (typically Support Zone 1).
Trend Reversals: In trend reversal, a buy signal occurs when price moves towards a support zone, typically Support 2 or Support 3, and the price of Bitcoin touches the support zone or only moves slightly through it and then reverses and starts heading in the other direction.
A sell trading signal occurs when price moves towards a resistance area, typically Resistance 2 or Resistance 3, and the price of Bitcoin Crypto Currency touches the resistance level or only moves slightly through it and then reverses and starts heading in the other direction.
Study More Tutorials & Lessons:
- How to Analyze Double Tops Chart Pattern
- How to Open a Demo MetaTrader 4 BTCUSD Trade Account in MetaTrader 4 Platform
- How Do I Draw BTC USD Trend Lines for Day BTCUSD?
- How to Analyze MetaTrader 5 Fibonacci Extension in MetaTrader 5 Trading Platform
- How to Analyze Chart Trading Analysis Using Market Trend
- Bollinger Bands Breakout BTC USD Trade Strategy
- Swap Free BTC USD Trade Account Definition
- How Do I Add a BTCUSD Trade Chart in MetaTrader 4 Platform?
- Learn BTCUSD Analysis Step By Step Guide
- BTC USD Trade Live Account Opening Course Tutorial


